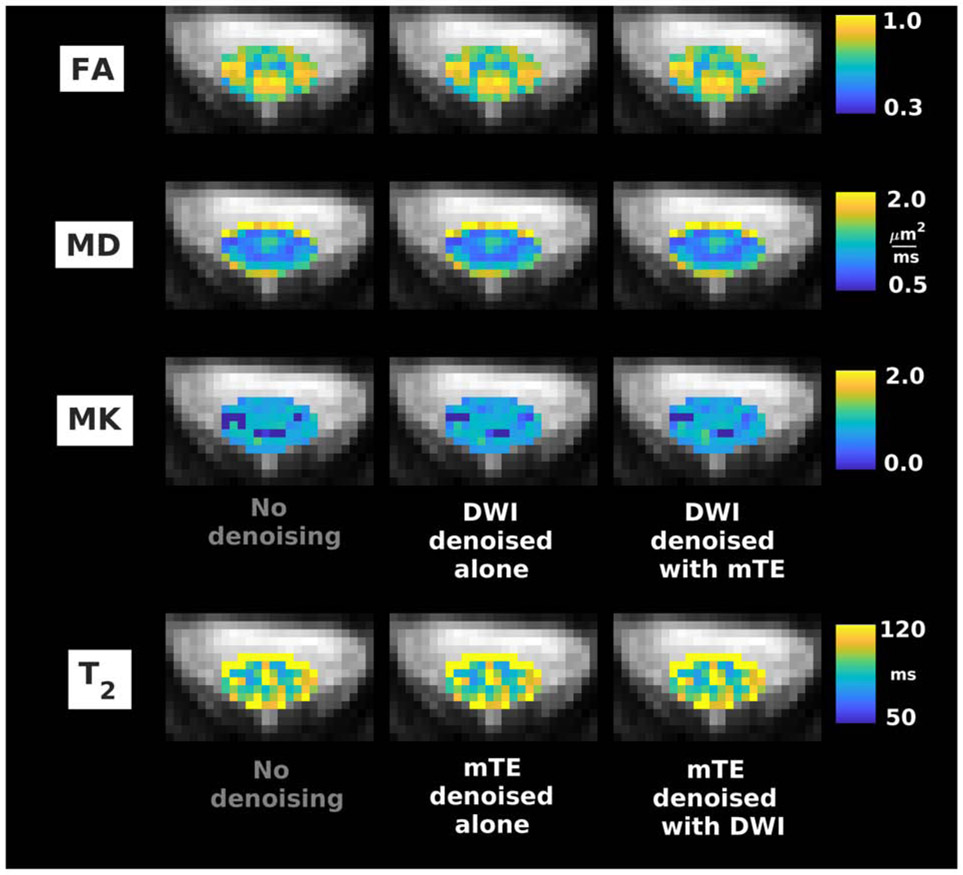
Fig. 6.
Examples of quantitative maps from vendor 2 (Siemens Prisma system located in New York, USA). From top to bottom: FA, MD, MK (DW imaging); T2 (mTE). Different rows illustrate the metrics obtained according to different denoising strategies (no denoising; independent denoising of each modality; various combinations of joint multi-modal denoising). Quantitative maps are overlaid onto the mean non-DW image and shown within the cord only. The same anatomical conventions with regard to subject’s anterior, posterior parts and right and left sides as in Fig. 4 are used.

