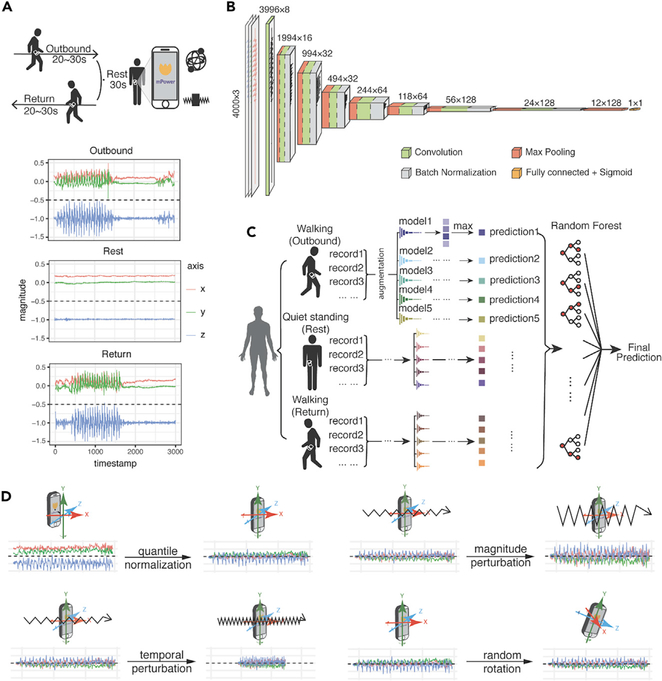
Figure 1. Walking Test Data Provided in the DREAM PDDB Challenge and Our Deep-Learning Model.
(A) Example of the walking activities carried out by subjects and accelerometer records during the three activities. During the walking test, the velocity of participants is recorded by the two sets of sensors implemented in their phones—gyroscope and accelerometer—represented by a set of free-spinning wells and a rigid body attached to a spring.
(B) The architecture of the convolutional neural network in this study. The numbers at the top of the boxes indicate the size of the layers and the numbers of the filters.
(C) The model ensemble method in this study. We trained five models by reseeding the training and validation sets, for outbound walking, rest (quiet standing), and return walking, respectively. For our final prediction, we assemble the predictions of the 15 modelsof outbound/rest/return by random forest and create a final prediction for each individual.
(D) Data-augmentation strategies applied in this study. The original record is first normalized by quantile normalization and then applied to three data-augmentation operations, namely magnitude perturbation, temporal perturbation, and random rotation.

