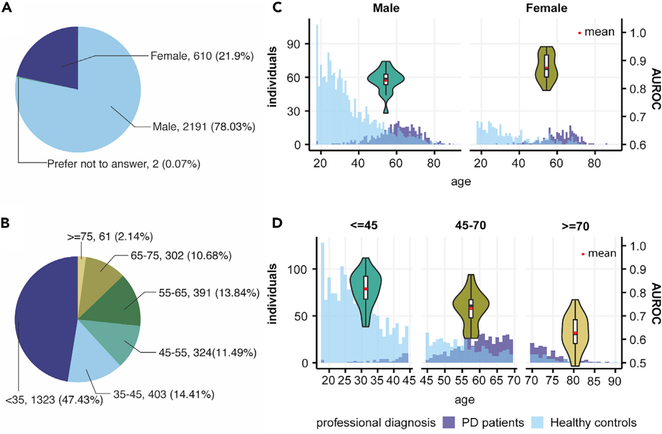
Figure 5. Demographics of Data at the Individual Level and Model Performances in Different Demographic Groups.
(A) Gender composition of participants in the mPower walking test.
(B) Age composition of participants in the mPower walking test.
(C) Age and PD patients/healthy controls distribution in male and female participants and comparison of AUROCs when our model is performed on either a male or female cohort in 5-fold cross-validation.
(D) Age and PD patients/healthy controls distribution in ourdataset and comparison of AUROCs when our model is performed on participants aged under 45 (<45), aged between 45 and 70 (45–70), and aged over 70 (≥70) years in 5-fold cross-validation.

