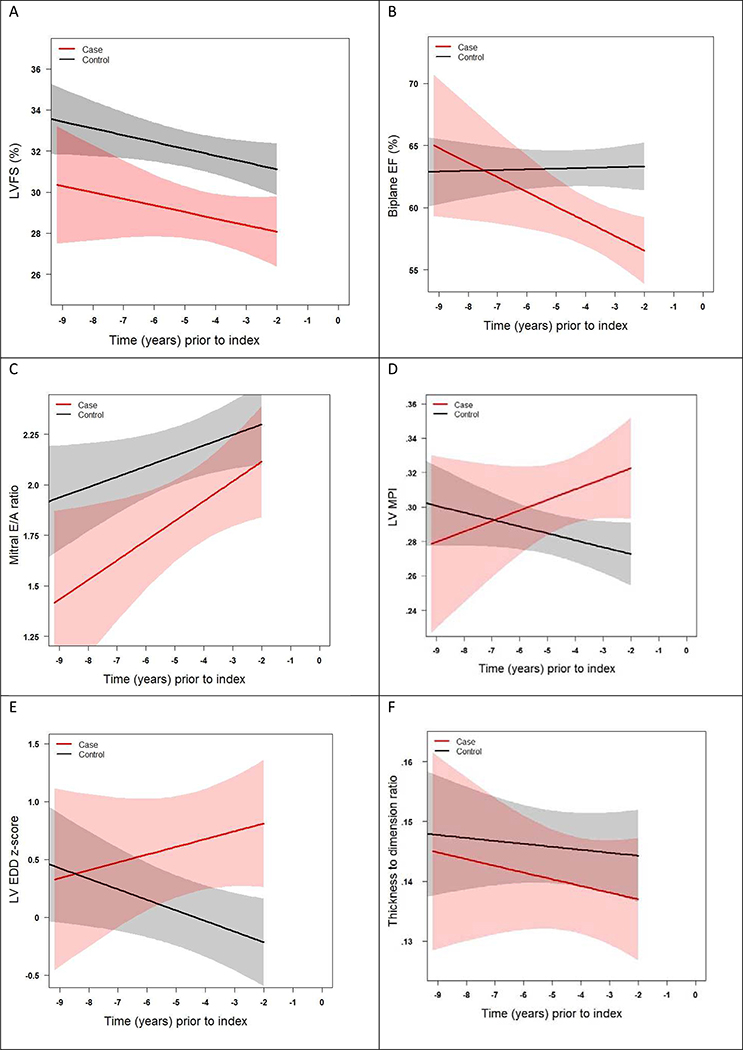
Central Illustration. Longitudinal Changes in Echocardiographic Functional Parameters Excluding Data from the 2 Years Prior to Cardiomyopathy.
Fitted line plots up to two years prior to cardiomyopathy, with 95% confidence intervals of (A) left ventricular fractional shortening [LVFS], (B) biplane Simpson’s derived ejection fraction [EF], (C) pulsed wave Doppler mitral E/A ratio, (D) pulsed wave Doppler derived myocardial performance index [MPI], (E) left ventricular end-diastolic dimension [LVEDD], and (F) left ventricular wall thickness to dimension ratio. Cardiomyopathy cases denoted by red line and controls denoted by black line, both based on a linear model. Time “0” denotes time point when cardiomyopathy was diagnosed

