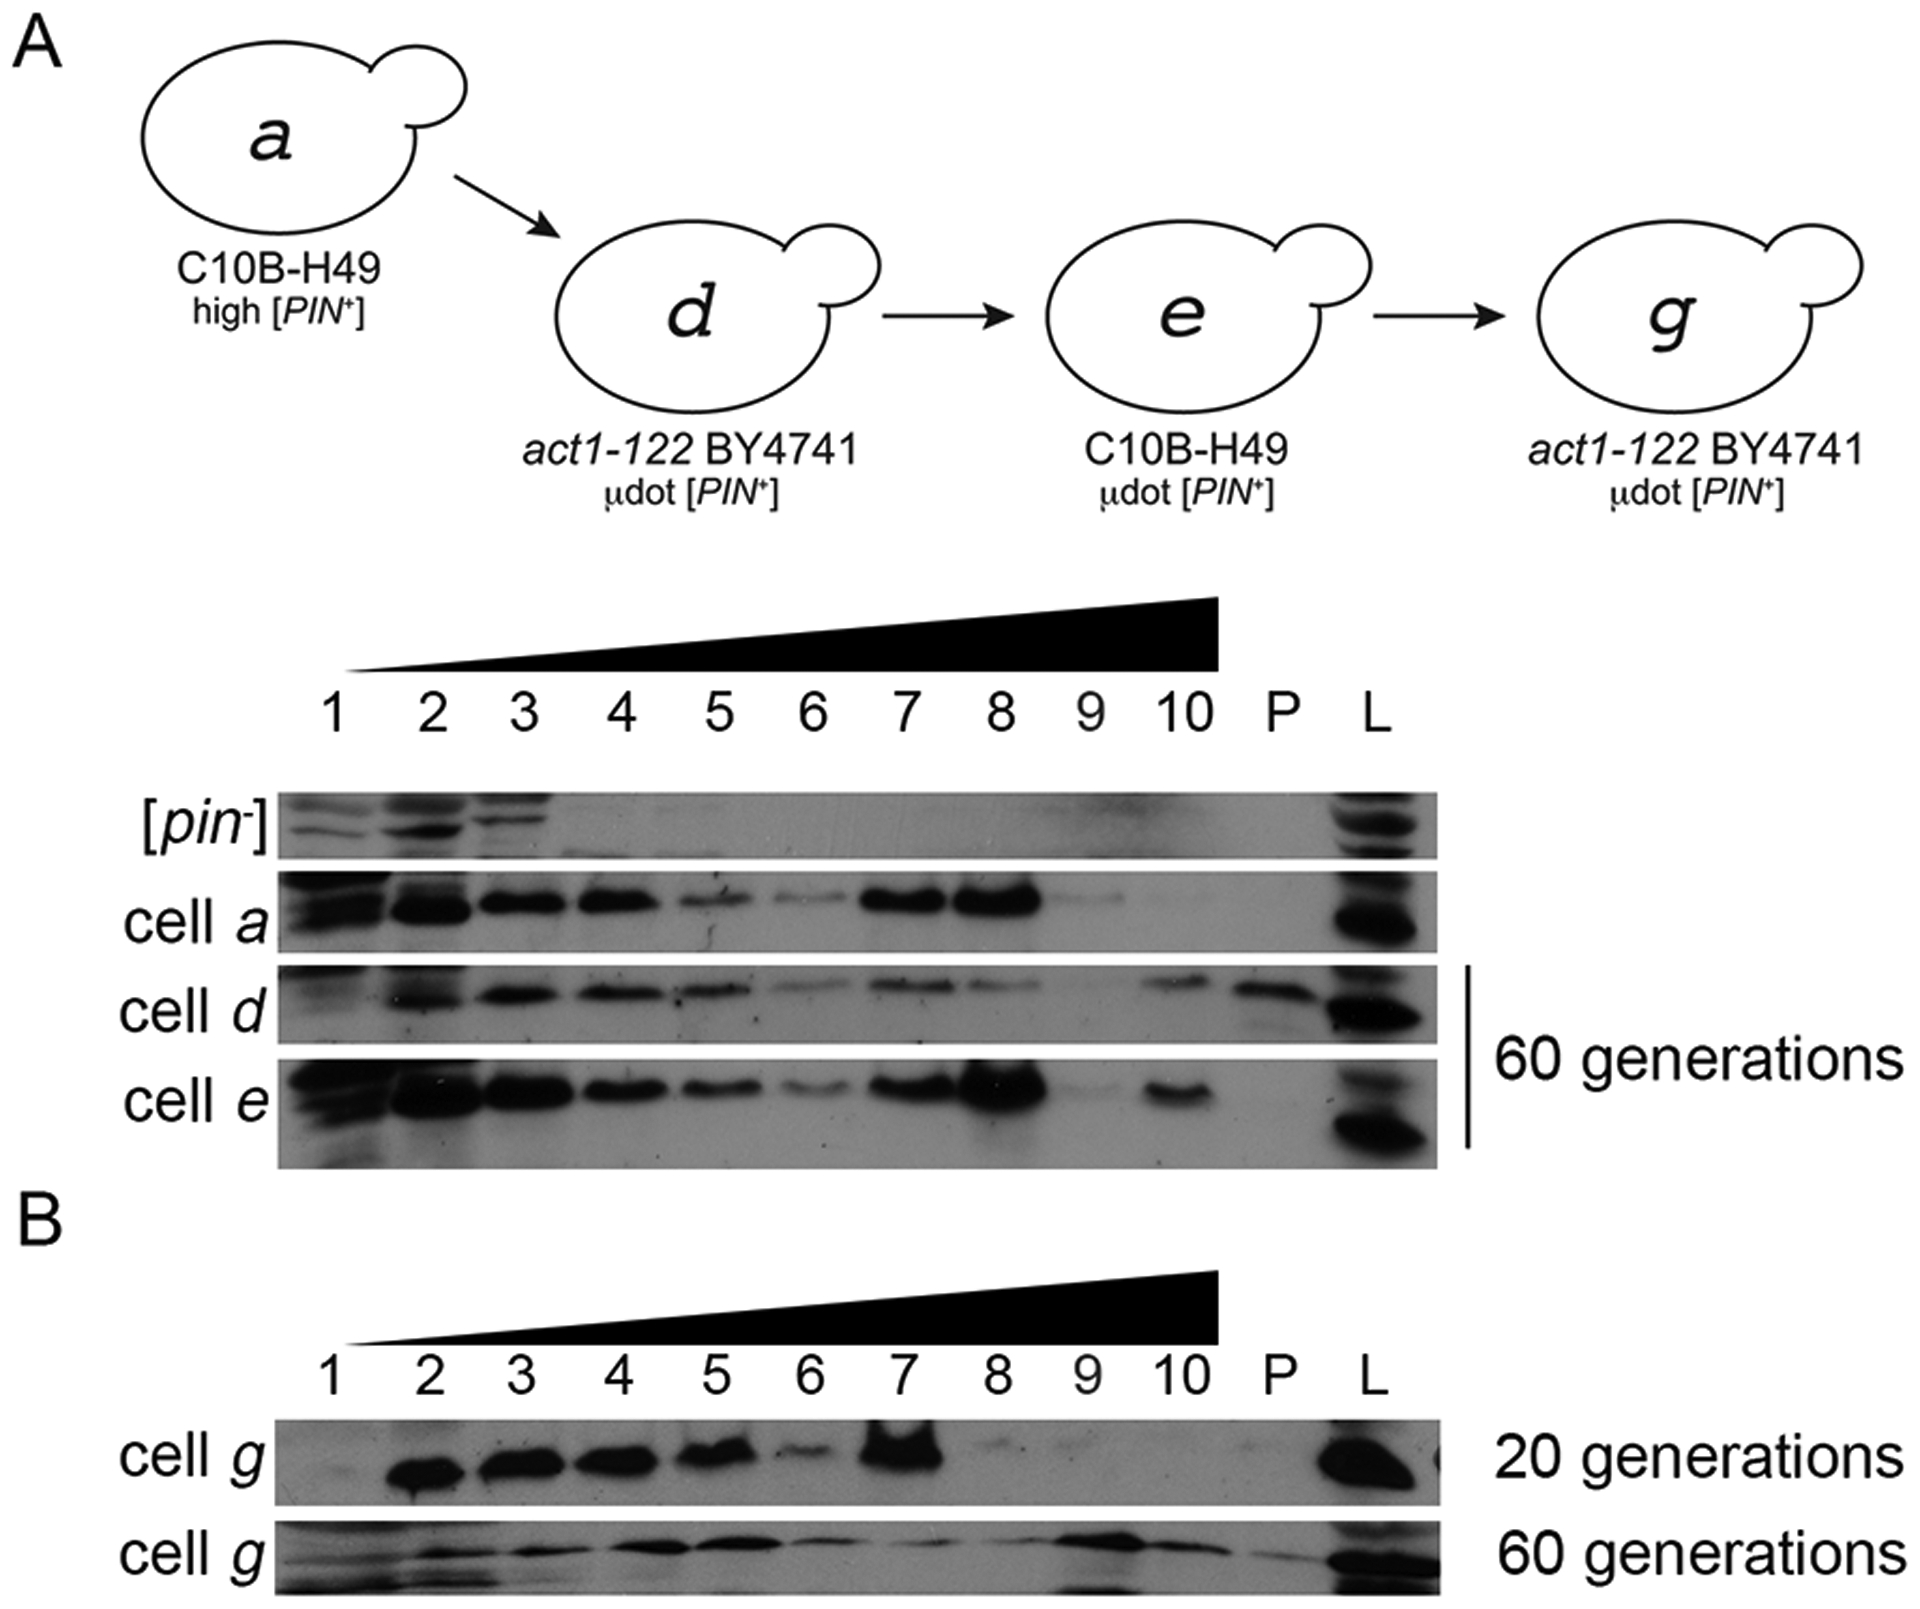
Figure 6. μdot [PIN+] aggregates increase in size over time in act1–122 mutants.

A. Cell lysates from cell a, d, and e were fractionated on a discontinuous (10%, 40%, 60%) sucrose gradient. Cell d and e were the same strains shown in figure 5C and D that were grown for 60 generations. As in Figure 1, fraction 1 represents the top of the gradient, fraction 10 is the bottom. The lane labeled P shows protein found in the pellet of gradient and L is whole cell lysates. B. Cell g was propagated for either 20 or 60 generations and lysates were run on discontinuous sucrose gradients. Each gel image is representative of biological replicate trials.
