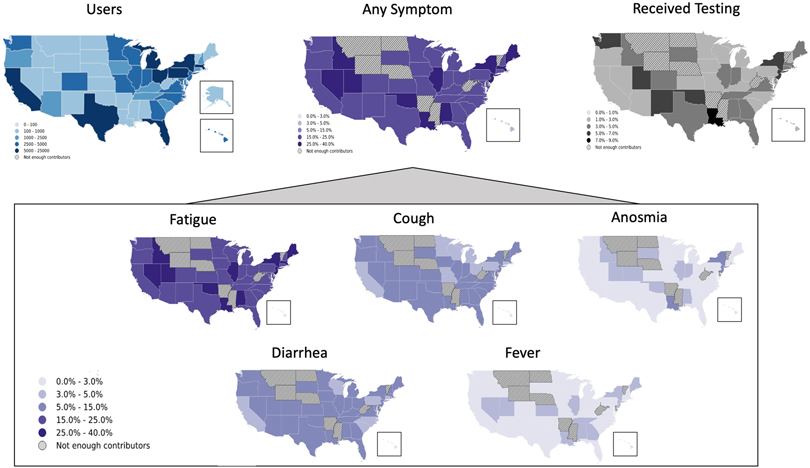
Figure 2.

COVID Symptom Study app use, reported symptoms, and testing rates by state in the United States. More than 150,000 unique individuals have downloaded the application and shared clinical and demographic information, as well as daily symptoms and high-intensity occupational exposures across the United States (blue map). Population density of those presenting with any symptoms varied according to states with widespread reports of fatigue, cough, and diarrhea, followed by anosmia and relatively infrequently, fever (inlay). Reported testing rates vary between states, with all states reporting testing rates lower than 10%. This example of real-time visualization of data captured by the COVID Symptom Study may assist public health and government officials in reallocating resources, identifying areas with unmet testing needs, and detecting emerging hot spots earlier. Alaska is omitted from maps where there were not enough contributors.
