Figure 5.

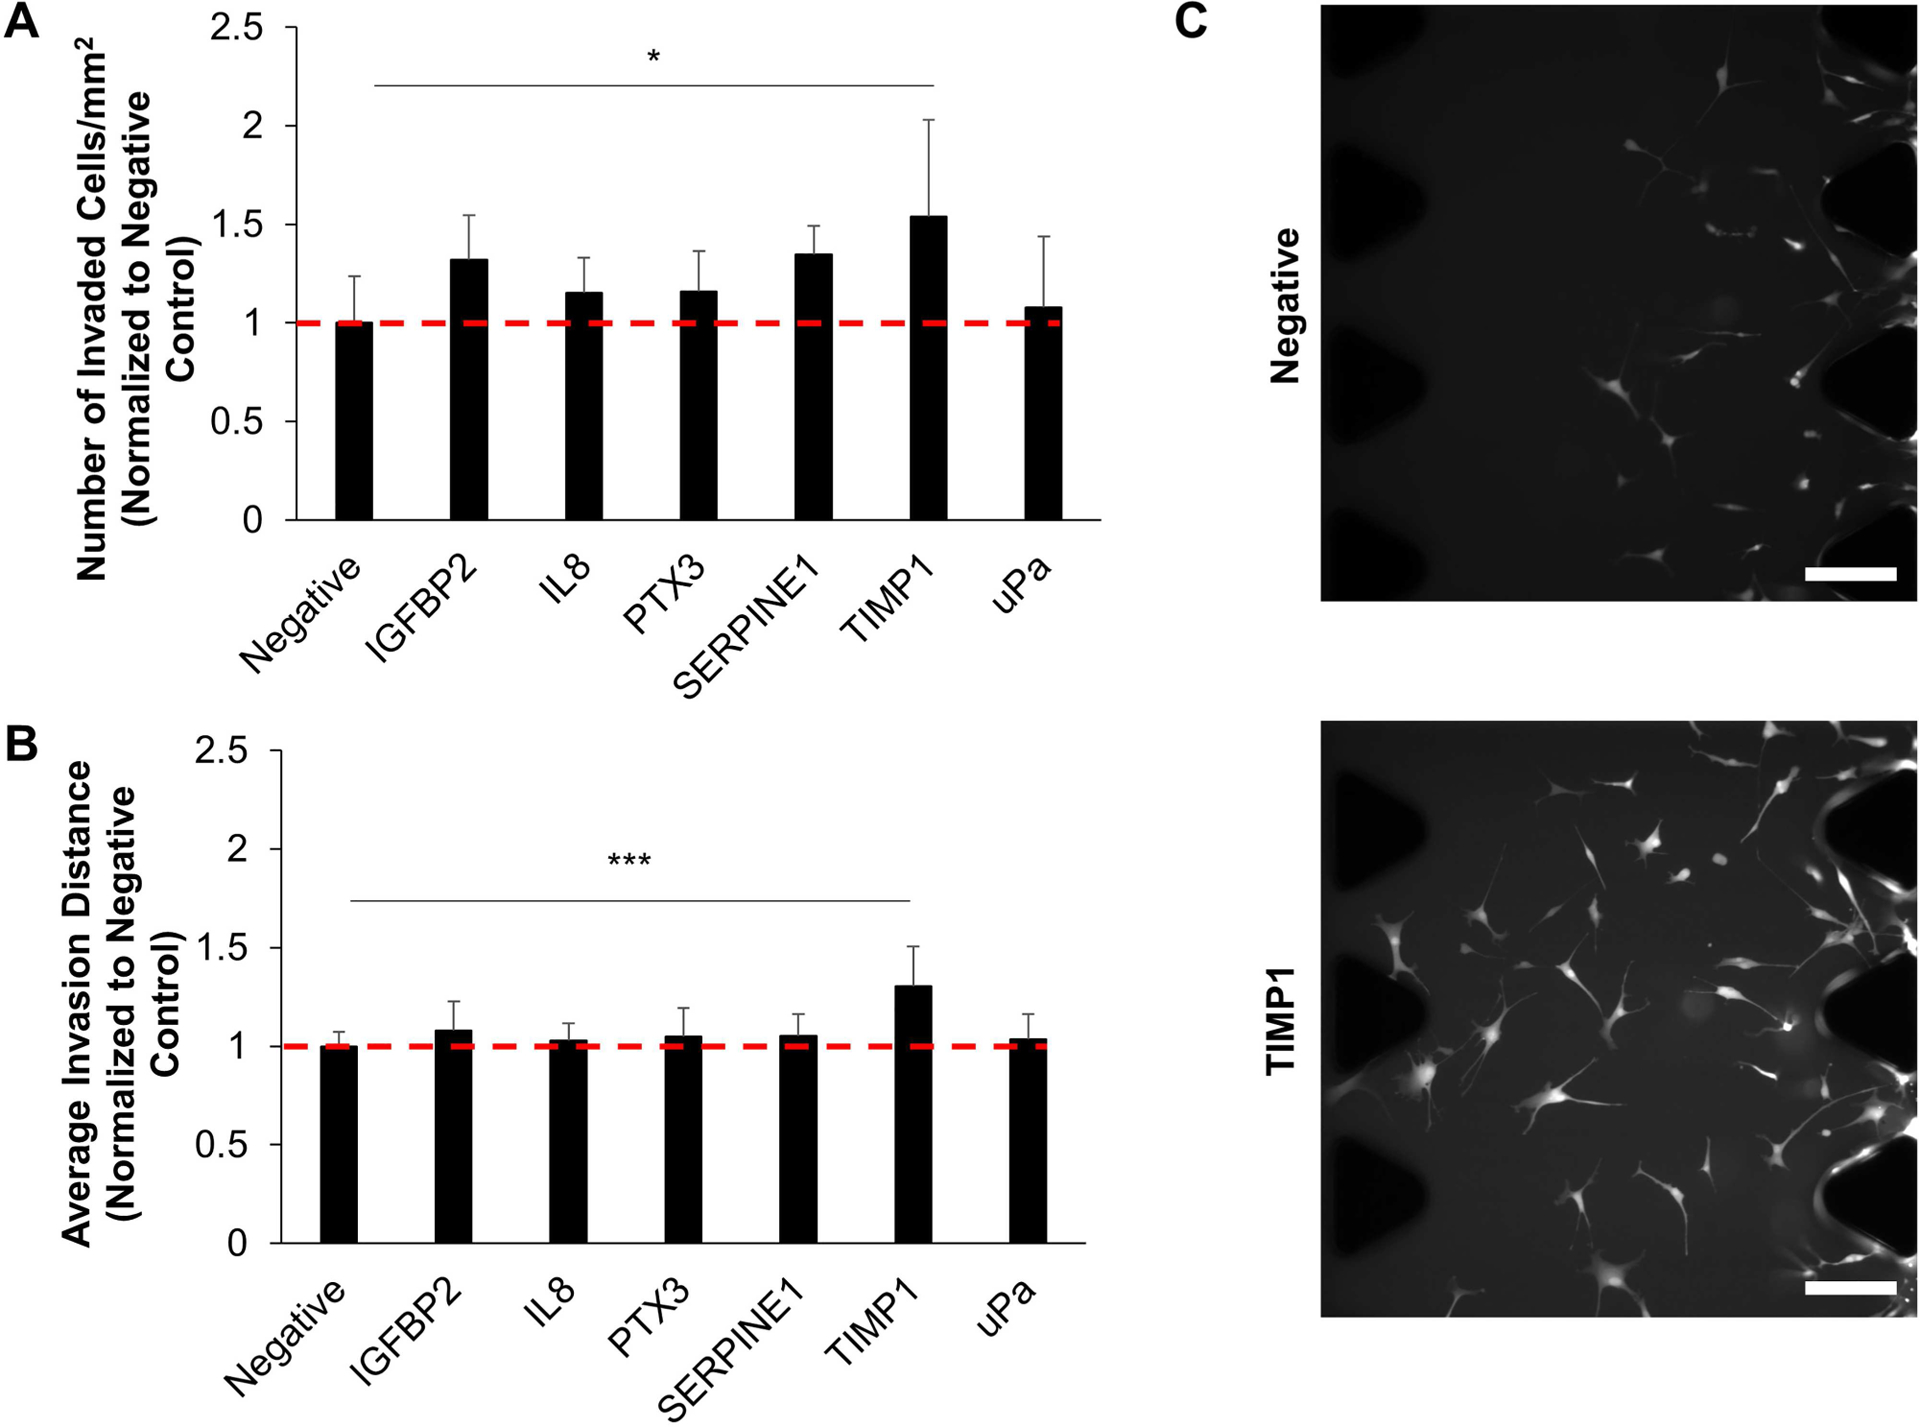
Migration was assessed in response to the presence of each protein loaded into the test channel of the microfluidic assay. The negative control was 1:1 DMEM + 2% FBS/EBM2 + 2% FBS alone. Proteins tested included those whose genes are upregulated in glioblastoma in addition to IL8, which has been shown to induce the migration of primary GBM cells. TIMP1 induced increases in the number of cells (A) and the average invasion distance (B) of cells migrating into the central gel channel. Data is normalized to the negative group. *P < 0.05, ***P < 0.001 between negative and TIMP1 groups. N = 6–9 devices. (C) Representative images of cells in the central gel channel. Scale bar = 200 μm.
