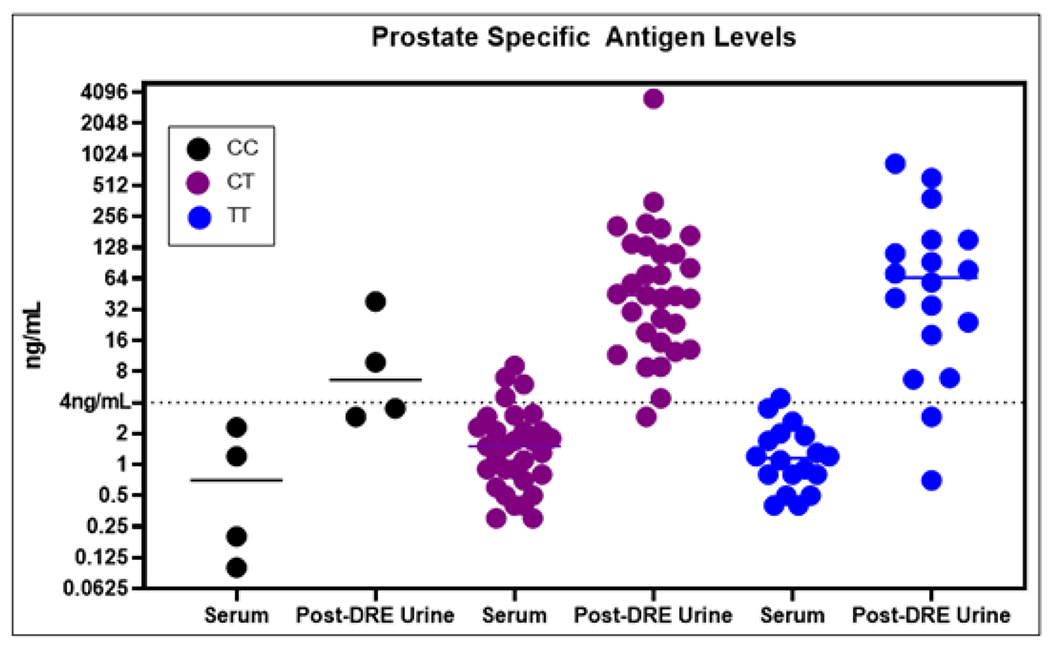
Figure 3: Prostate Specific Antigen Levels.

Prostate specific antigen (PSA) levels are shown across the various genotypes and sample sources. PSA is consistently more concentrated in post-DRE urines that increases the sensitivity of this assay compared to serum. In addition, the trends across the genotypes are mirrored between the two sample sources.
