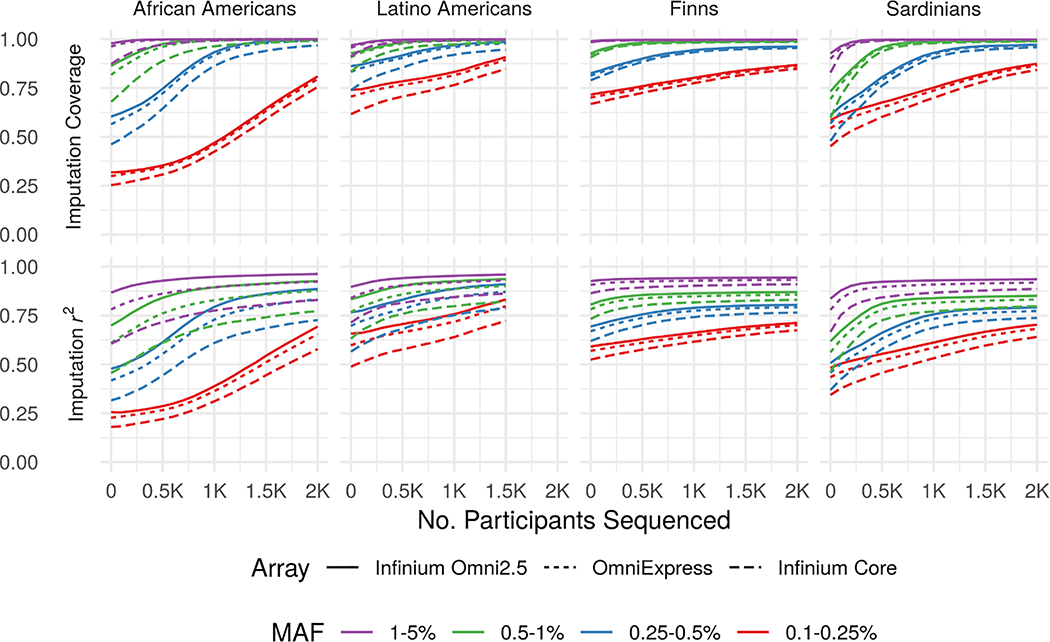
Figure 1. Imputation Quality by Population and Genotyping Array.
Imputation coverage (upper panels) and mean imputation r2 (lower panels) as functions of the number of population-matched individuals included in augmented reference panels (Number Sequenced, x-axis). Here and elsewhere, MAF is calculated separately within each population.

