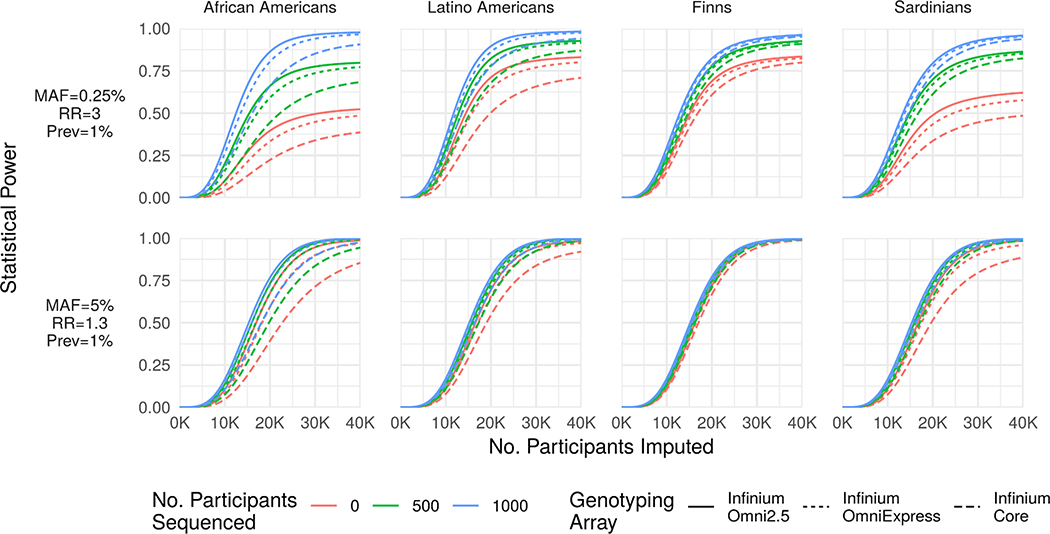
Figure 3. Power as a Function of Minor Allele Frequency and Effect Size.
Statistical power (y-axis) to detect a rare large-effect variant (MAF=0.25%, RR=3; top row) and common modest-effect variant (MAF=5%, RR=1.3; bottom row) for a disease with prevalence 1% as a function of the number of participants array-genotyped and imputed (x-axis) when 0, 500, or 2,000 participants are sequenced and included in an augmented reference panel. The number of participants sequenced has a far greater impact on statistical power for the rare variant association. Importantly, statistical power is bounded above by the probability that the variant is imputable (r2 > 0.3 and reference MAC ≥ 5), causing power to asymptote below 1 as a function of the number of imputed participants (e.g., upper-left panel).

