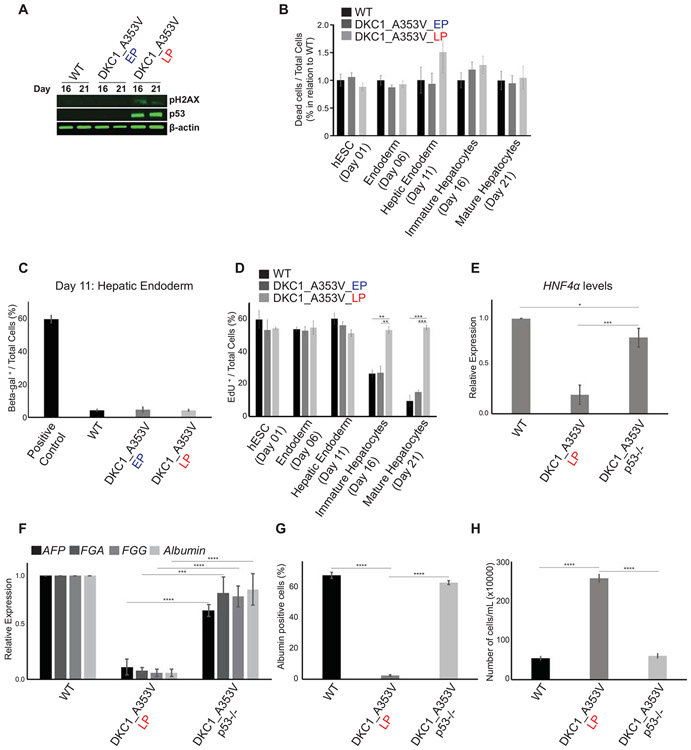
Figure 4: p53 stabilization impairs hepatocyte development from DKC1_A353V mutant hESCs.
(A) Representative immunoblot analysis of γH2AX and p53 expression on Days 16 and 21 of hepatic differentiation (immature and mature hepatocyte stages) of WT and DKC1_A353V hESCs (at early and late passages). β-actin is shown as loading control. (B) Quantification of dead cells by propidium iodide (PI) incorporation during different stages of hepatocyte development (indicated in the figure) in WT, DKC1_A353V_EP, and DKC1_A353V_LP cells. Fraction of PI positive cells presented over the total number of cells observed in each of the differentiation stages indicated. Results are presented in relation to WT cells for each stage. (C) Beta-Gal positive cells were quantified (by light microscopy) in WT, DKC1_A353V_EP, and DKC1_A353V_LP cells on Day 21 of differentiation (mature hepatocyte-like stage). Positive control: senescent human primary fibroblasts (BJ cells). Fraction of beta-gal positive cells presented over the total number of cells observed in each condition. (D) Quantification of cellular proliferation by 5-ethynyl-2’-deoxyuridine (EdU) incorporation during different stages of hepatocyte development (indicated in the figure) in WT, DKC1_A353V_EP, and DKC1_A353V_LP cells. Fraction of EdU positive cells presented over the total number of cells observed in each of the differentiation stages indicated. (E) Generation of hepatic endoderm population quantified by the relative gene expression (by real-time quantitative PCR) of HNF4α in WT, DKC1_A353V_LP and the p53 ablated DKC1_A353V_p53−/− cells. (F) Relative expression of hepatocyte markers by real-time quantitative PCR after 21 days of differentiation (mature hepatocyte stage) in WT, DKC1_A353V_LP and DKC1_A353V_p53−/− cells. (G) Quantification of albumin positive cells by immunofluorescence after 21 days of differentiation in WT, DKC1_A353V_LP and DKC1_A353V_p53−/− cells. (H) Total number of cells after hepatic differentiation of WT, DKC1_A353V_LP, and DKC1_A353V_p53−/− cells. Cells were collected on Day 21 and figure shows total number of cells found in each population (total numbers quantified by cell counter). n=3, mean ± SEM, *p≤0.05; **p≤0.0025; ***p≤0.001; ****p≤0.0001. Statistical analysis was performed using one-way ANOVA followed by Tukey’s post hoc test.

