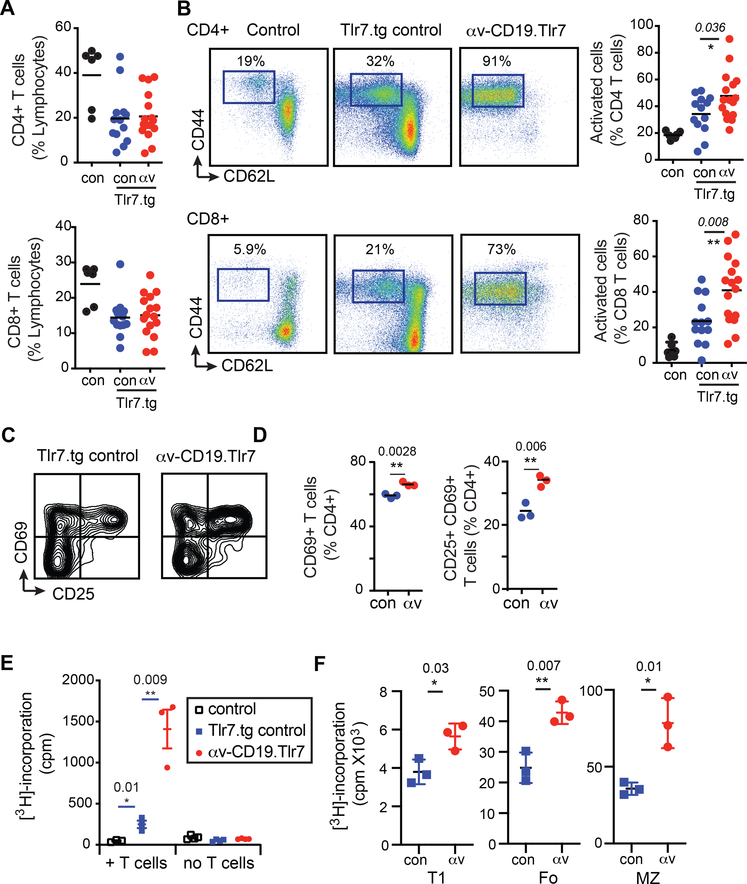
Figure 3: Increased T cell activation in αv-CD19.Tlr7.1 transgenic mice:
(A,B) Spleens from 7–8 week old wild-type control mice (con), Tlr7.tg controls (con-Tlr7.tg) and αv-CD19.Tlr7 mice (αv-Tlr7.tg) were analyzed for CD3+ CD4+ and CD3+ CD8+ T cells as a frequency of total splenocytes by FACS (A). CD4 and CD8 were further analyzed for expression of CD44 and CD62L cells as shown (B). Each data point represents a single mouse. p-values <0.05 (Mann-Whitney test) for comparisons between control Tlr7.1 tg and αv-CD19.Tlr7.1 tg mice are shown, and indicated as by * (p<0.05) or ** (p<0.01) (n=6 non-transgenic, n≥13/group transgenic mice). (C-E) B cells from TLR7.tg controls and αv-CD19.Tlr7 mice were cultured with CD4+ T cells from control mice in the presence of anti-CD3. T cell activation (based on CD25 and CD69) (C,D) and cell proliferation measured by [3H]-thymidine incorporation (E) were measured after 3 days. (F) Sorted transitional, marginal zone and follicular B cells from control TLR7.1 transgenics (con-Tlr7.1) and αv-CD19.Tlr7.1 transgenic mice (αv-Tlr7.1) were cultured with control CD4+ T cells in the presence of anti-CD3, and cell proliferation measured after 48 hr. All data shown are mean±SD of replicate cultures from one experiment. Similar results were seen in at least 3 independent experiments. p-values <0.05 (Student’s t-test) for comparisons between control Tlr7.1 tg and αv-CD19.Tlr7.1 tg mice are shown, and indicated as by * (p<0.05) or ** (p<0.01).

