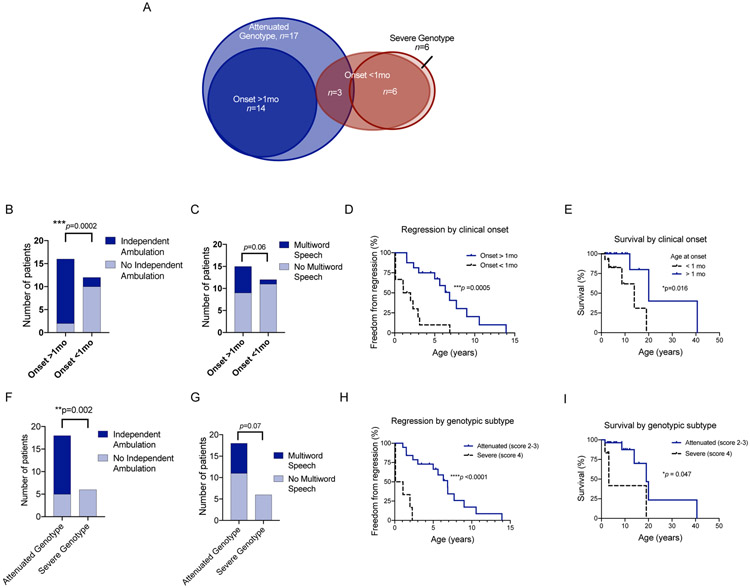
Figure 7. Early features that correlate with outcomes in MSD.
(A) Venn diagram showing the overlap between subjects presenting in the neonatal period (<1mo, dark red, n=9), subjects with a severe genotype (light red, n=6), subjects presenting after the neonatal period (>1mo, dark blue, n=14), and subjects with attenuated genotypes (light blue, n=17). The cohort was divided by age of onset before or after 1 month, and the number of subjects that attained (B) independent ambulation and (C) multiword speech are shown (chi-square test, p values as labeled). (D) Freedom from regression divided by age of onset is shown (log-rank Mantel-Cox test, p=0.0005). (E) Survival divided by age of onset is shown (log-rank Mantel-Cox test, p=0.016). The cohort was also divided by genotype severity (attenuated = score of 2-3, severe = score of 4), and the number of subjects that attained (F) independent ambulation and (G) multiword speech are shown (chi-square test, p values as labeled). Freedom from regression divided by genotype severity is shown (log-rank Mantel-Cox test, p<0.0001). Neurologic regression (H) and survival (I) are presented by Kaplan-Meier curves, with subcohorts defined by genotype severity (log-rank Mantel-Cox test, p<0.0001 and p=0.047 respectively).

