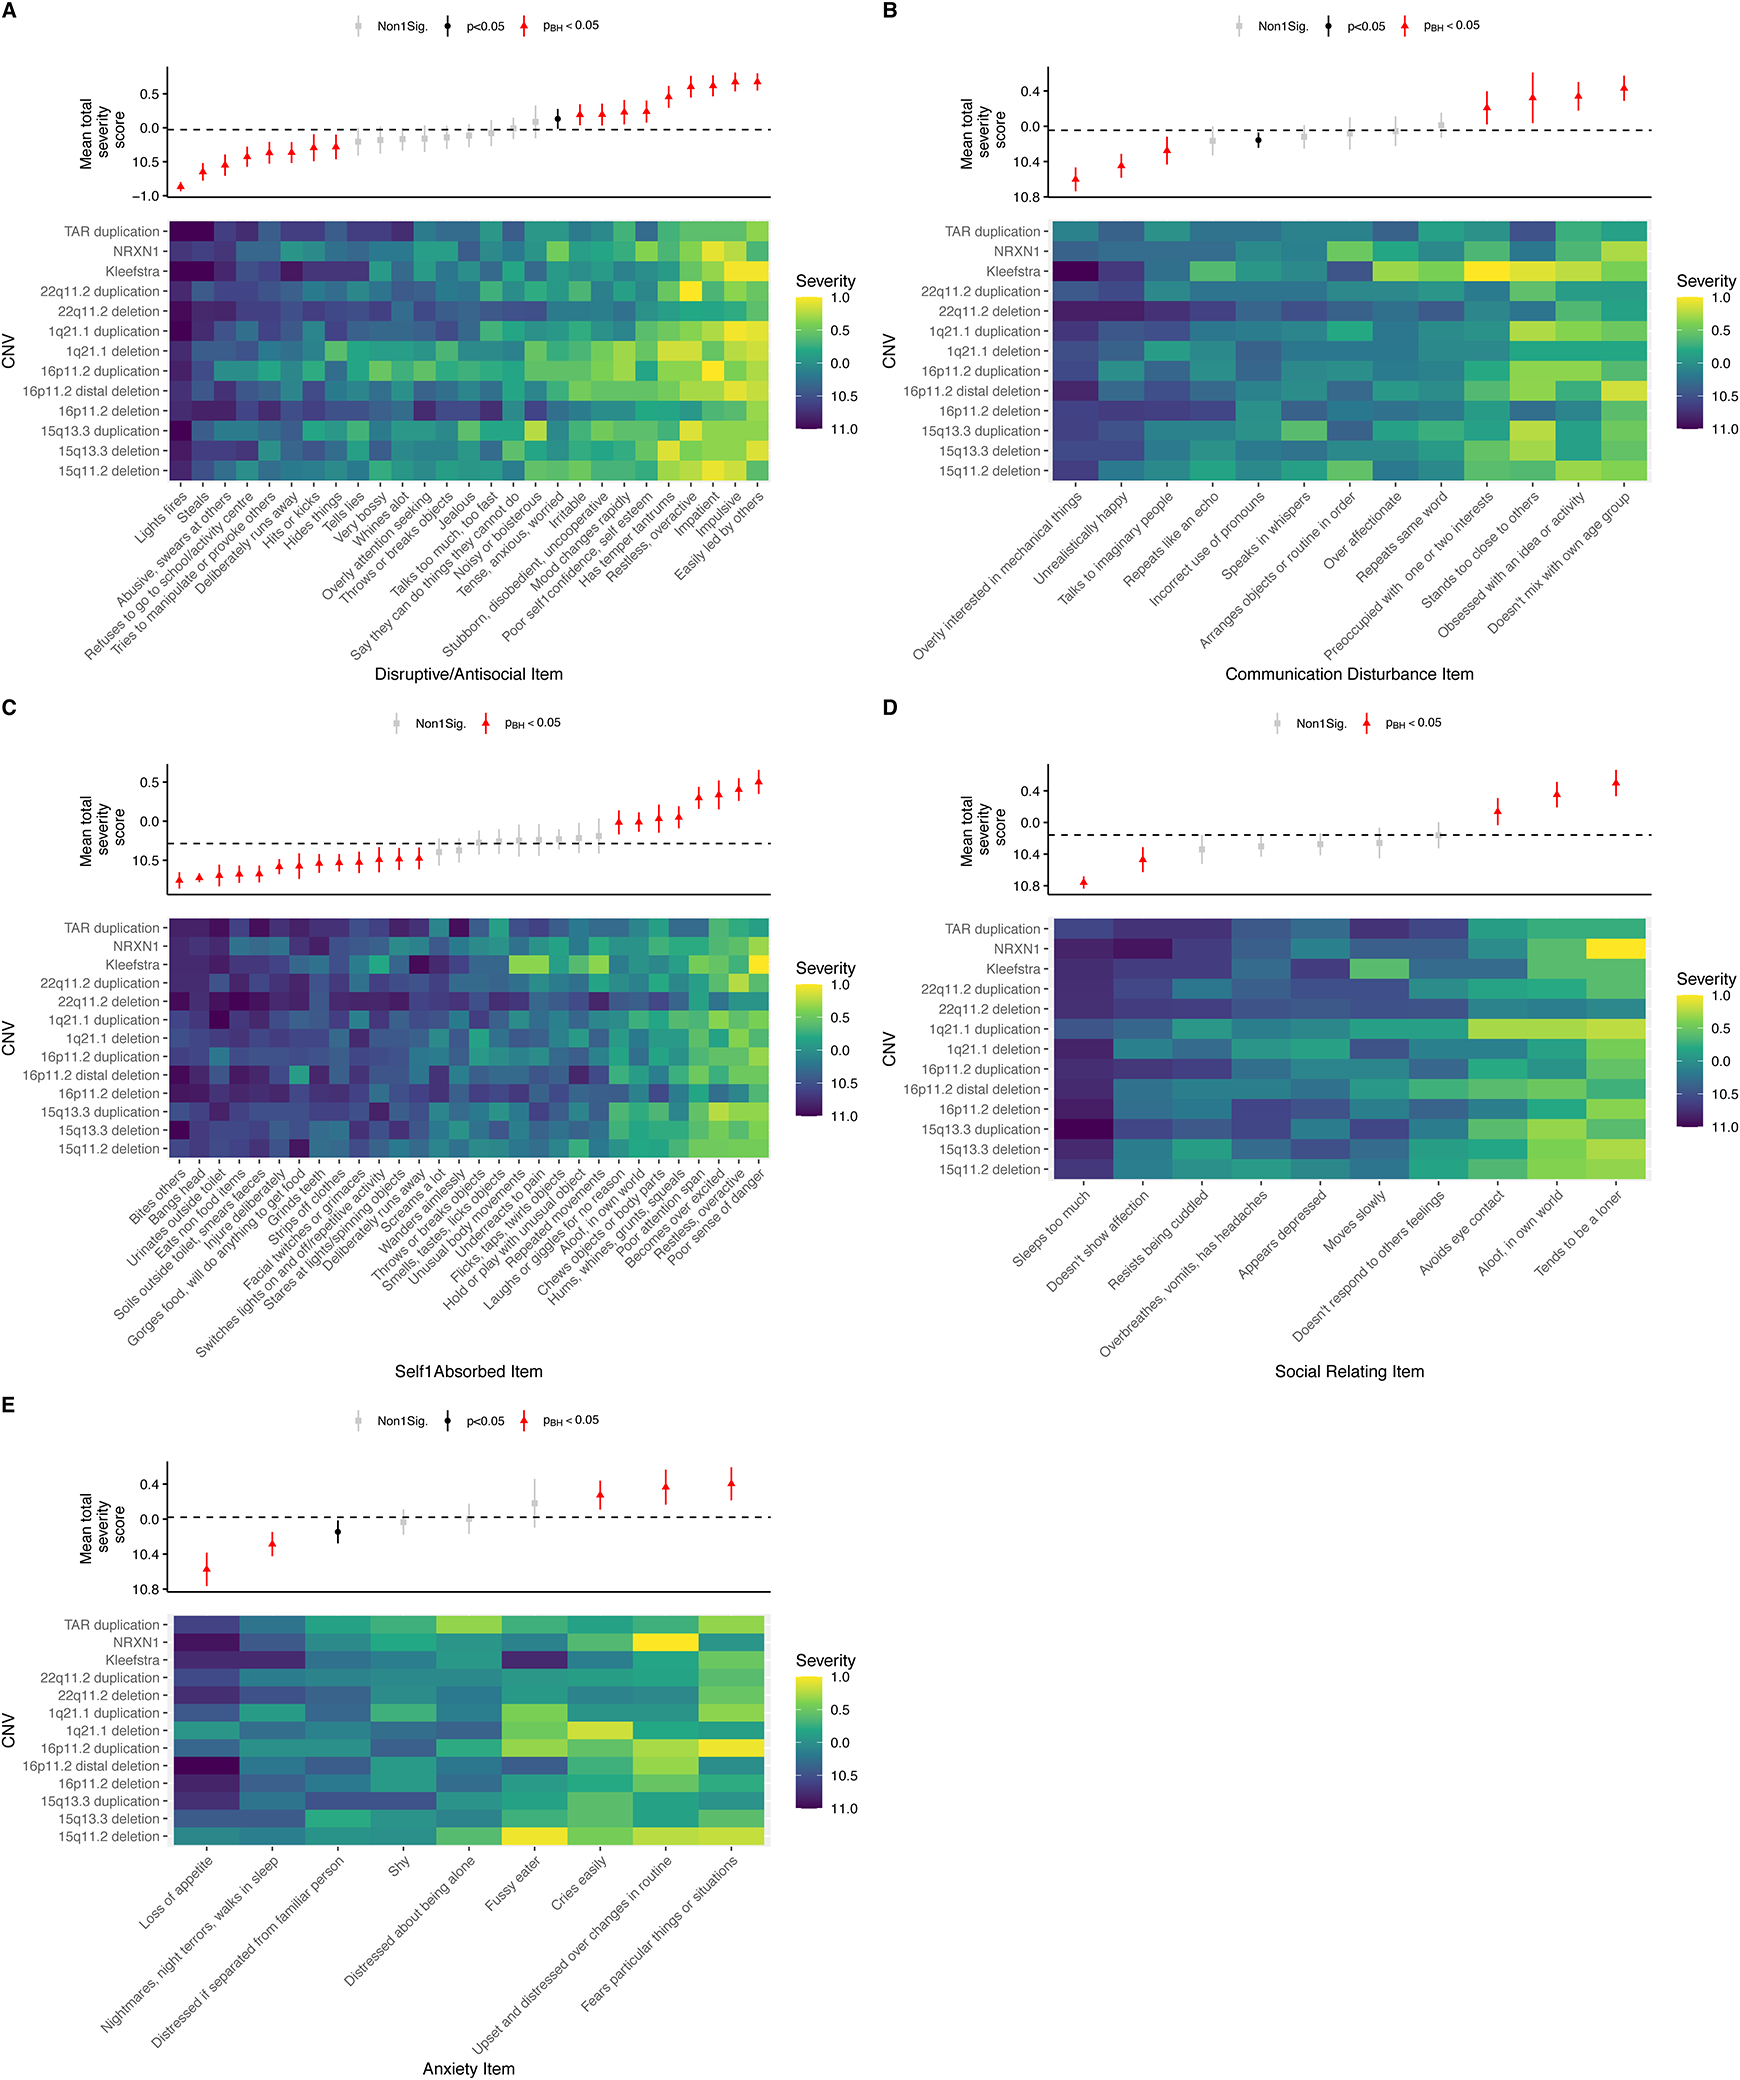
Figure 1.

Heat plots of scores for the items constituting the five subscales of the DBC A) disruptive/antisocial, B) communication disturbance C) self-absorbed D) social relating and E) anxiety. Items are ordered on the x-axis by mean total severity score for each question across the entire ND-CNV sample, from lowest on the left to highest on the right. The chart above each heat plot shows the mean total severity score and 95% confidence interval for each question. Point shape corresponds to the significance of results of a t-test comparing the mean of the total severity score of the question to the overall mean for all items in the scale. Squares indicate a nonsignificant difference, cirlces indicate a nominally significant difference and triangles indicate questions that survived Benjamini-Hochberg correction.
