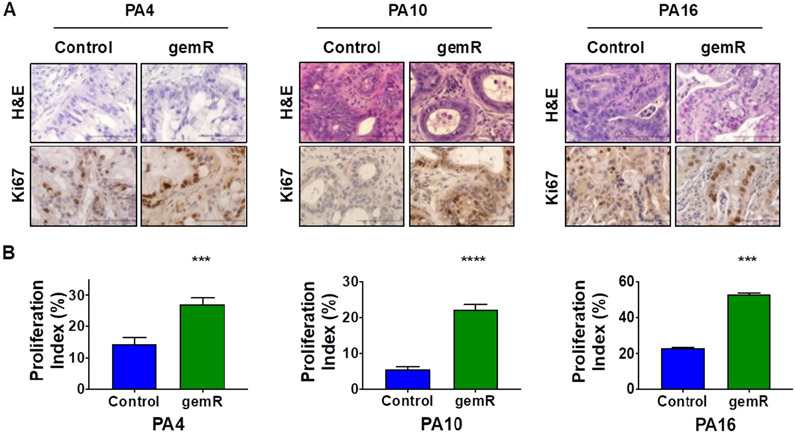
Figure 2.
All gemR models showed increased levels of proliferation marker Ki67. Tumor tissue harvested on days 190, 120, and 179 for PA4.gemR, PA10.gemR and PA16.gemR, respectively, was stained with H&E to visualize tumor and stroma morphology, and was immunostained for the proliferation marker Ki67. Tumor tissue harvested from control mice bearing PA4, PA10 or PA16 tumors (gemcitabine-naïve) served as controls for IHC staining experiments. Scale bar = 10 μm (A); data in ‘A’ were quantitated to determine Ki67 proliferation indices (%). Bar graphs show mean ± S.E.M. Ki67 expression. Data were analyzed using Student’s t-test (***P < 0.001, ****P < 0.0001) (B). gemR: gemcitabine resistance; IHC: immunohistochemistry

