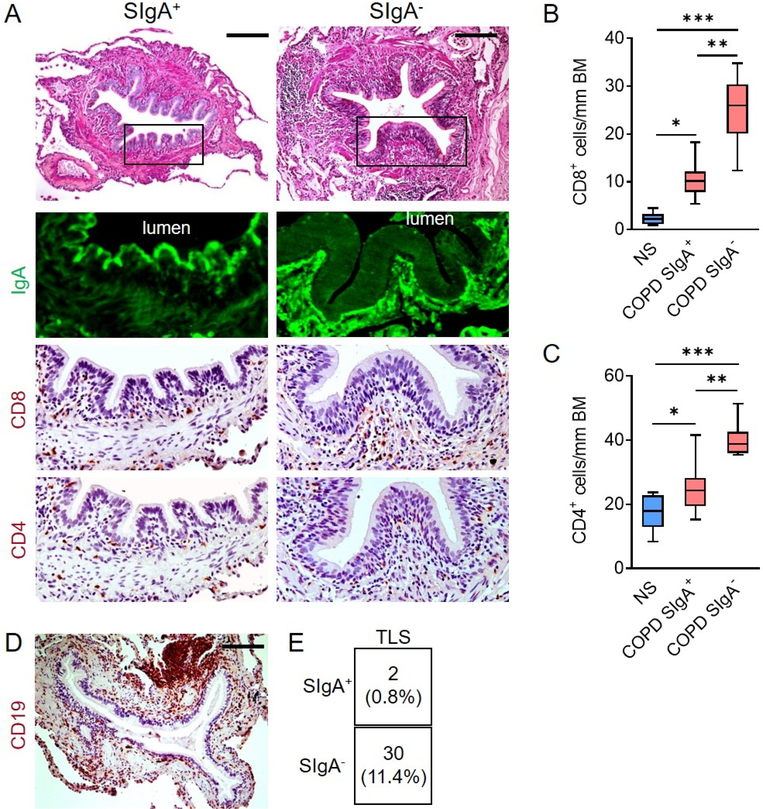
Figure 1. T and B lymphocytes preferentially accumulate around SIgA-deficient airways in patients with COPD.
(A) Immunostaining for SIgA (green) and CD4 or CD8 (brown) in 5 μm lung sections from a COPD patient. Scale bar = 100 μm. (B to C) Quantification of CD8+ (B) or CD4+ (C) T lymphocytes/mm basement membrane in 5 μm lung sections from COPD patients according to airway SIgA status and lifelong non-smokers (NS). Small airways from COPD patients were classified as SIgA+ or SIgA− based on quantification of SIgA immunofluorescence. (D) Example of a tertiary lymphoid structure in a COPD patient as determined by immunostaining for CD19. Scale bar = 100 μm. (E) Table illustrating the number and percentage of TLS according to airway SIgA status. (B) * = p<0.01 compared to NS, ** = p<0.0001 compared to COPD SIgA+, *** = p<0.0001 compared to NS, (ANOVA). (C) * = p<0.05 compared to NS, ** = p<0.001 compared to COPD SIgA+ airways, *** = p<0.0001 compared to NS (ANOVA). Box-and-whisker plots represent median, interquartile range, and range.

