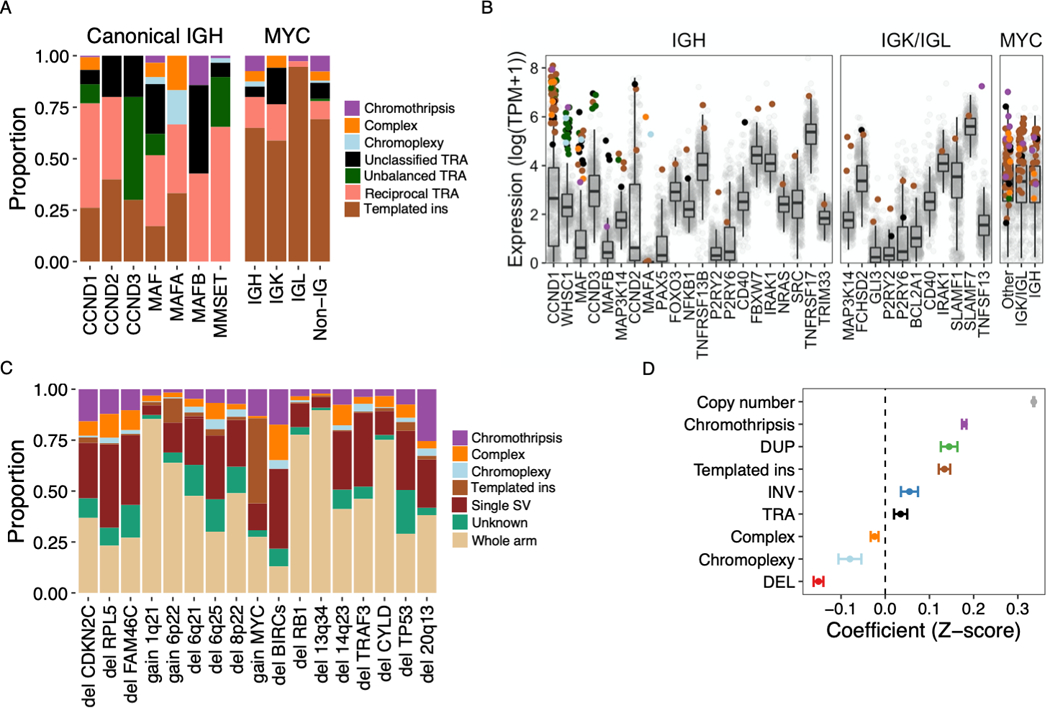
Figure 3: Structural variants associated with recurrent translocations, copy number changes and altered gene expression.

A) Relative contribution (y-axis) of simple and complex SV classes to canonical translocations (TRA) involving IGH as well as translocations of MYC with canonical and non-canonical partners (x-axis). “Non-IG” includes MYC-translocations that do not involve IGH, IGL or IGK. B) Gene expression of canonical and non-canonical partners of translocations involving IGH (left), either light chain gene locus (center) or MYC (right). Each point represents a sample, colored by the translocation class involved or absence of a translocation (gray). Boxplots shows the median and interquartile range (IQR) of expression across all patients, with whiskers extending to 1.5 * IQR. The templated insertion of IGH and MAF with low expression was part of a multi-chromosomal event involving and causing the overexpression of CCND1. C) Structural basis of established multiple myeloma CNA drivers, showing the relative contribution of whole arm events and CNAs associated with a specific SV. Intrachromosomal events without a clear causal SV were classified as “unknown” (7% of CNAs overall). D) Impact of copy number and SV involvement on normalized gene expression values (Z-scores), estimated by multivariate linear regression. Estimates with 95% CI for each parameter are shown. Pooled analysis was performed for all expressed genes on autosomes across all patients, excluding structural events involving immunoglobulin loci.
