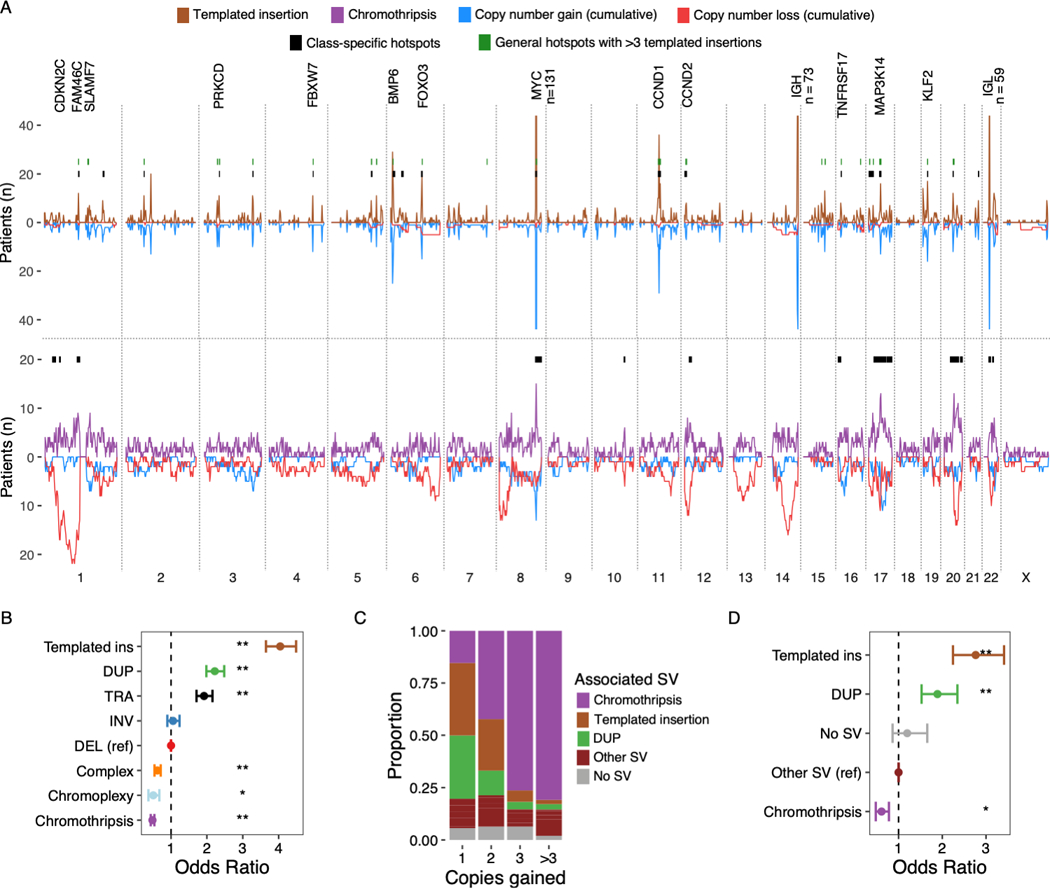
Figure 6: Templated insertions and chromothripsis exemplify highly clustered versus scattered breakpoint patterns.

A) Distribution of templated insertions (above) and chromothripsis (below) across the genome, for each displaying SV breakpoint density above the X-axis and SV-associated cumulative copy number changes below. Results from templated insertion and chromothripsis-specific hotspot analysis drawn as black bars at y = 20. Hotspots from the main hotspot analysis which contained 6 or more templated insertions are drawn in green. Key putative driver genes involved by hotspots are annotated. Numbers are annotated where peaks extend outside of the plotting area B) The probability that a given SV breakpoint belonging to each class will fall within a hotspot region, expressed as odds ratios with 95% CI from logistic regression analysis where single deletions were used as the reference level. C) Showing the proportion of focal gains (<3 Mb) associated with each SV class, divided by the number of copies acquired relative to the baseline (x-axis). D) Shows the probability that focal gains displayed in C) contain a multiple myeloma super-enhancer, expressed as odds ratio with 95% CI from a logistic regression model adjusted for copy number. Asterisks in B and D indicate statistical significance: ** = p < 10−8; * = p<0.01.
