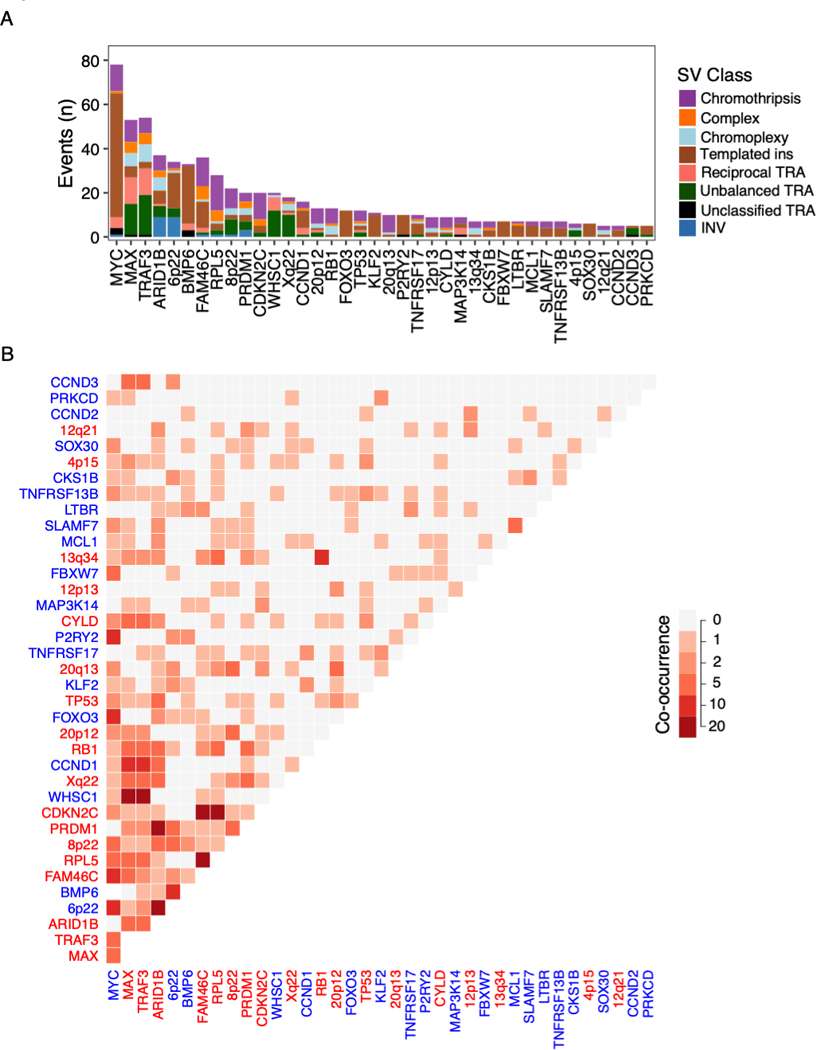
Figure 7: Two or more putative driver alterations caused by a single SV.

Putative driver alterations recurrently involved by multi-driver events (involved in 5 or more patients) A) Number of multi-driver events involving each gene colored by the SV class responsible. B) Heatmap showing the number of times each pair of putative drivers co-occur. Co-occurrence was defined by at least two drivers on different chromosomal copy number segments caused by the same event. Axis legends are colored according to the gain-of-function (blue) or loss-of-function (red) status of each driver.
