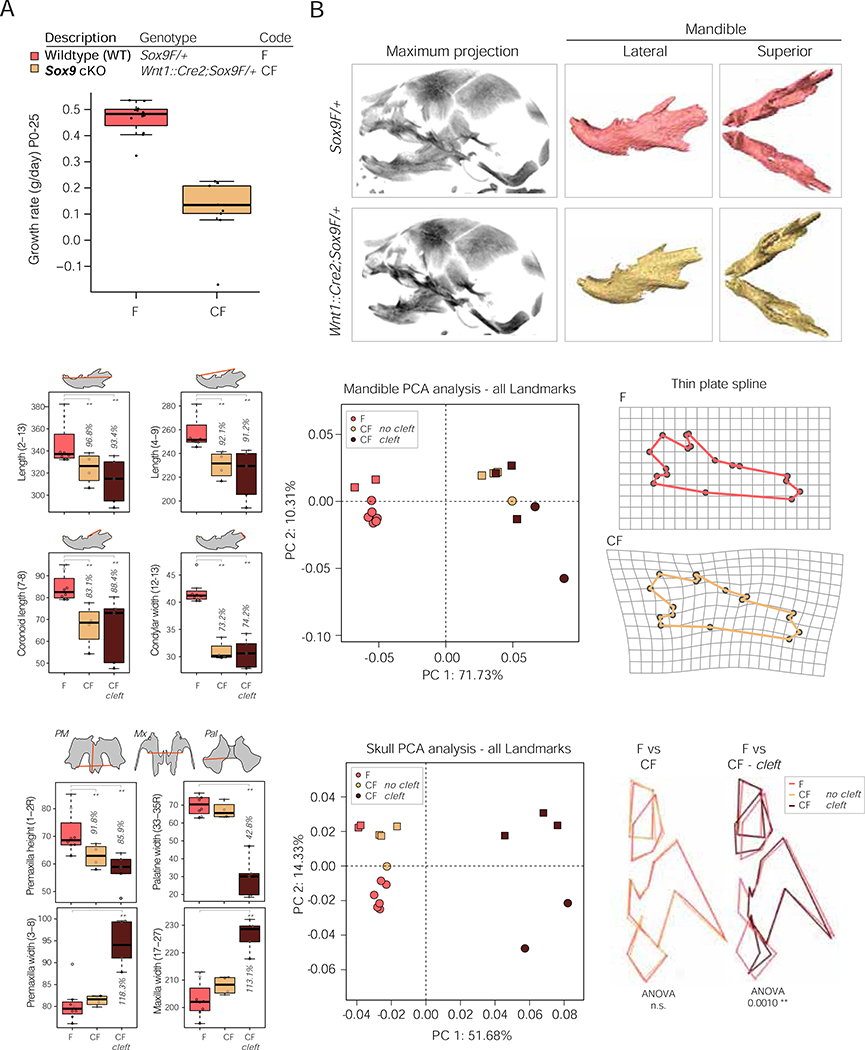
Figure 5: Conditional neural-crest specific Sox9 heterozygous mutant embryos have craniofacial defects and fail to thrive in the neonatal period.
(A) Boxplot of postnatal growth rate in g/day for mutant Wnt1::Cre2;Sox9F/+ (CF) and wildtype Sox9F/+ (F) pups (ANOVA p-val = 1.793e-07).
(B) MicroCT scans of E18.5 wildtype (upper) and mutant (lower) embryos, maximum intensity projection (left) and segmented hemimandibles (right).
(C) Boxplot of distance measurements for wildtype (F) and mutant mandibles with (CF cleft) and without (CF) cleft palate. Data from two litters (17 embryos).
(D) PCA of mandible landmarks following Procrustes analysis. Mutant (CF) and wildtype (F) mandibles are separated by PC1 regardless of clefting.
(E) Morphometric landmarks for wildtype (upper, F) and mutant (lower, CF) mandibles projected onto a thin plate spline. All 18 landmarks differed significantly between wildtype and mutant mandibles by Hotelling test (p < 0.0006).
(F) Boxplot of distance measurements for wildtype (F) and mutant midfacial elements with (CF cleft) and without (CF) cleft palate. PM, premaxilla; Mx, maxilla; Pal, palatine bones.
(G) PCA of skull landmarks following Procrustes analysis. Mutant skulls without cleft (CF) cluster with wildtype skulls (F).
(H) Wireframe outline of nasal bone, premaxilla, maxilla and palatine bone for half a skull for wildtype (F, dark pink) and mutant skulls without cleft (CF, yellow, left) or with cleft (CF, brown, right).
For PCA, different shape markers represent independent litters.

