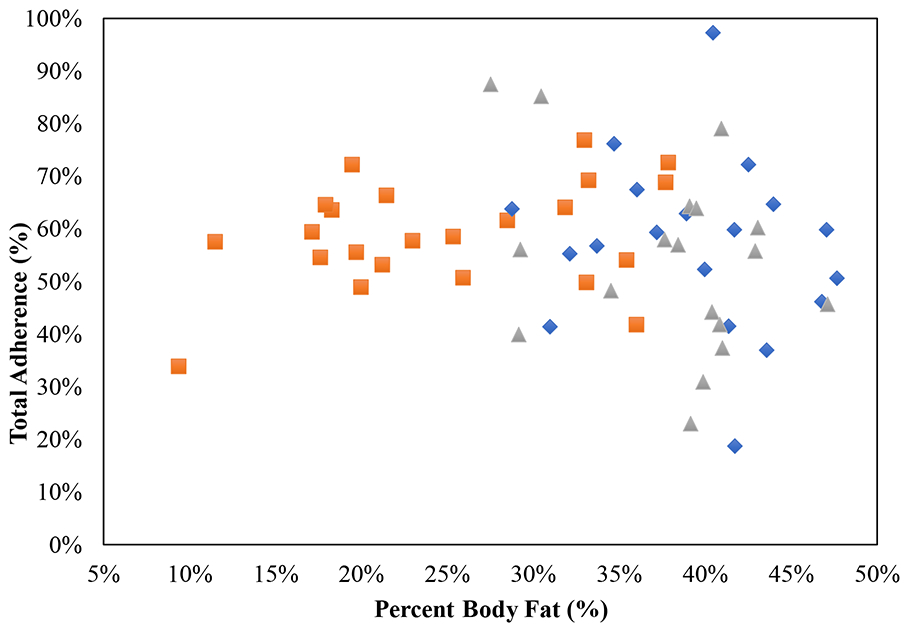
Figure 2.

Association between baseline percent body fat (PFAT) and total percent adherence (%), the Pearson correlation coefficient (r) is reported along with its significance. The lean group is represented by orange squares, individuals with obesity CR blue diamonds and the individuals with obesity WMEN group-grey triangles.
