Figure 4.


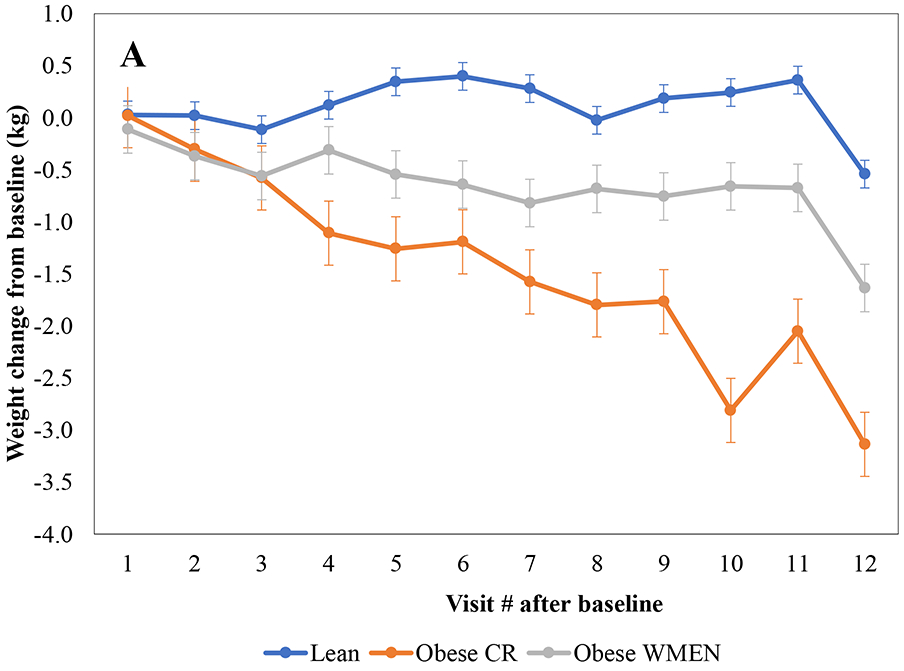
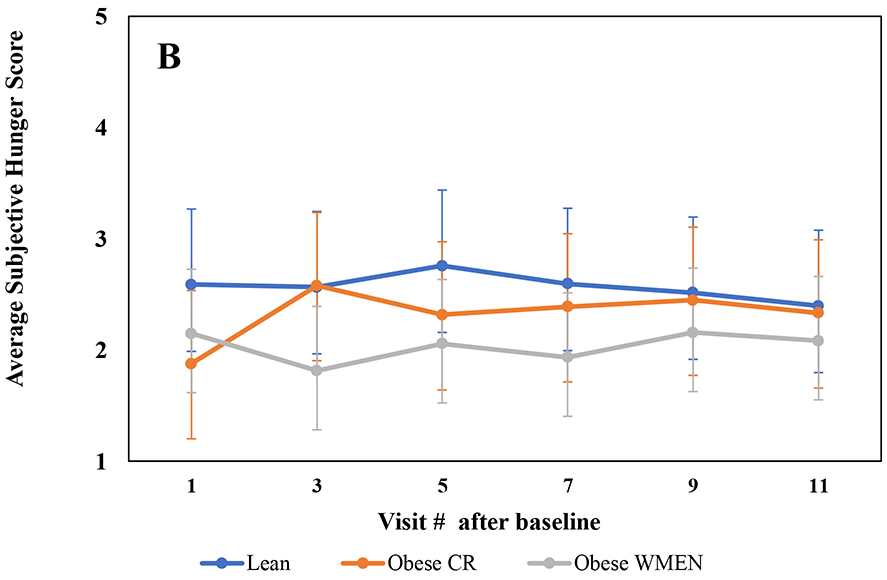
A, Absolute weight change trajectories (Visit weight-baseline weight) show that were the individuals with obesity CR group lost significantly more weight over the 6-weeks compared to the individuals with obesity WMEN and lean groups (p=0.02). B, Average subjective hunger score trajectories were not significantly different between groups (p=0.08). Error bars represent 95% confidence intervals of the means. Mixed models were adjusted for age, time (days), sex and baseline weight (weight loss model only) using an AR(1) covariance structure.
