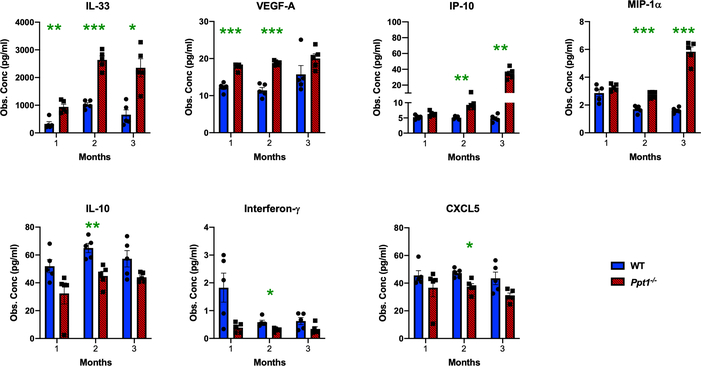
FIGURE 4 – Early cytokine profile alterations in Ppt1−/− mouse spinal cords reveal specific inflammatory changes.
Observed concentrations (Obs. Conc) in pg/μl of various cytokines measured in spinal cord homogenates from WT and Ppt1−/− mi ce revealing significant early upregulation of IL-33 and VEGF-A as early as 1 month, and of IP-10 and MIP-1α at 2 months (MO) in Ppt1−/− cords and significant downregulation of IL-10, Interferon-γ and CXCL5 were also seen at 2 months in Ppt1−/− cords as compared to WT cords. P-values - P-values - *p≤0.05, **p≤0.01, ***p≤0.001, two-way ANOVA with post-hoc Bonferroni correction. Values shown are mean ± SEM. (n = 5 mice/group).

