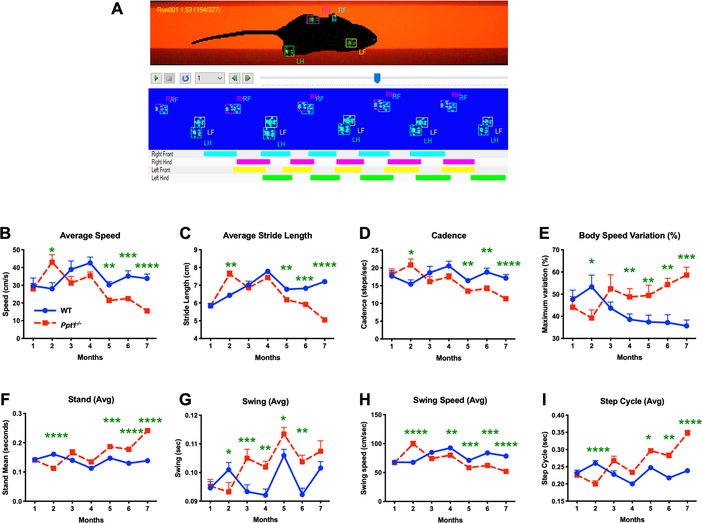
FIGURE 7 – CatWalk XT data acquisition and early gait abnormalities in Ppt1−/− mice.
(A) Representative frame of the captured video from a single run on the Catwalk XT gait analysis system showing each paw print as a fluorescent green mark. These are then classified as Right Fore (RF), Left Fore (LF), Right Hind (RH) or Left Hind (LH). The schematics below show placement of these classified paw prints over the duration of the run, with coloured bars indicating the periods when each foot was in contact with the glass floor of the apparatus. CatWalk XT measures showing Ppt1 deficient (Ppt1−/−) mice having a higher average speed (cm/sec) (B), stride length (cm) (C) and cadence (steps/sec) (D) at 2 months compared to wild-type (WT) mice, followed by a subsequent progressive decline across all these parameters with increased age. Variation of body speed (E) over a run (%) mirrored this pattern, with markedly less variation at 2 months which increases with age in Ppt1−/− mice as compared to WT mice. The measures of stand (sec) (F), swing (G), swing speed (cm/sec) (H) and step cycle (sec) (I) were also indicative of a supra-normal gait at 2 months. P-values - *p≤0.05, **p≤0.01, ***p≤0.001, ****p≤0.0001; two-way repeated measures ANOVA with post-hoc Bonferroni correction. Values shown are mean ± SEM. (n = 12 mice/group).

