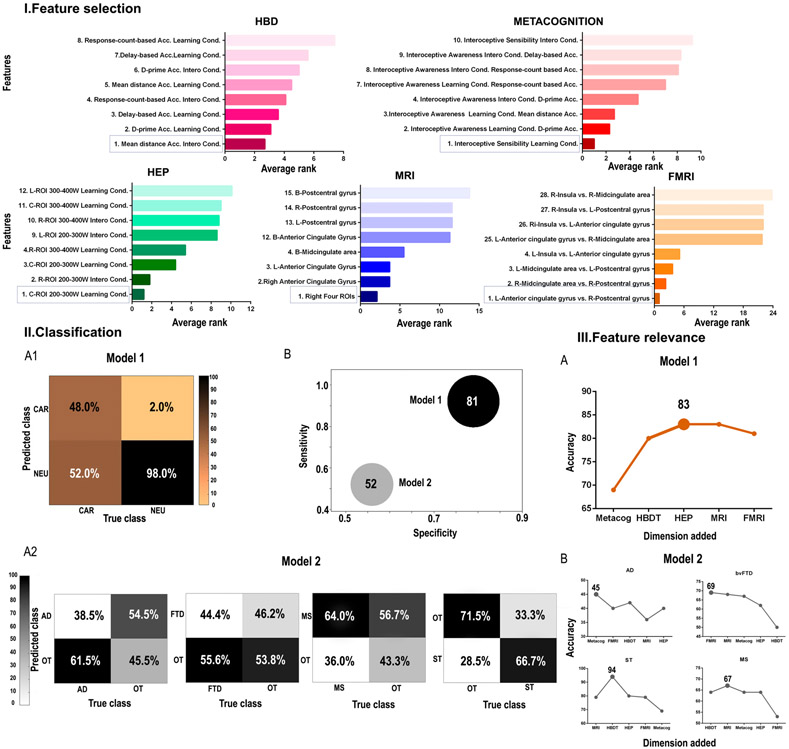
Figure 2. Main Results.
I. The average rank of features is shown for each dimension, presenting the first and the last four variables ranked. II. 1. Model 1: classification between the neurological and the cardiac group. 2. Model 2: Classification among neurological conditions. A. Confusion matrix of each analysis. B. Accuracy, specificity, and sensitivity are represented for both analyses. Sphere size is proportional to accuracy value. 3. Feature relevance analysis for each model (A for the comparison between the neurological and the cardiac group; B for the comparison among neurological conditions). These figures show the model’s accuracy as each dimension is added following the order of importance of each feature. L: left; R: right; Acc: accuracy; B: bilateral; cond.: condition; AD: Alzheimer’s disease; ST: stroke; MS: multiple sclerosis; FTD: (behavioral variant) fronto-temporal dementia; NEU: neurological; CAR: cardiac; OT: other neurological diseases; HDB: heart-beat detection task (accuracy); HEP: heart-evoked potential; MRI: magnetic resonance imaging; fMRI: functional magnetic resonance imaging; ROI: region of interest; W: window.

