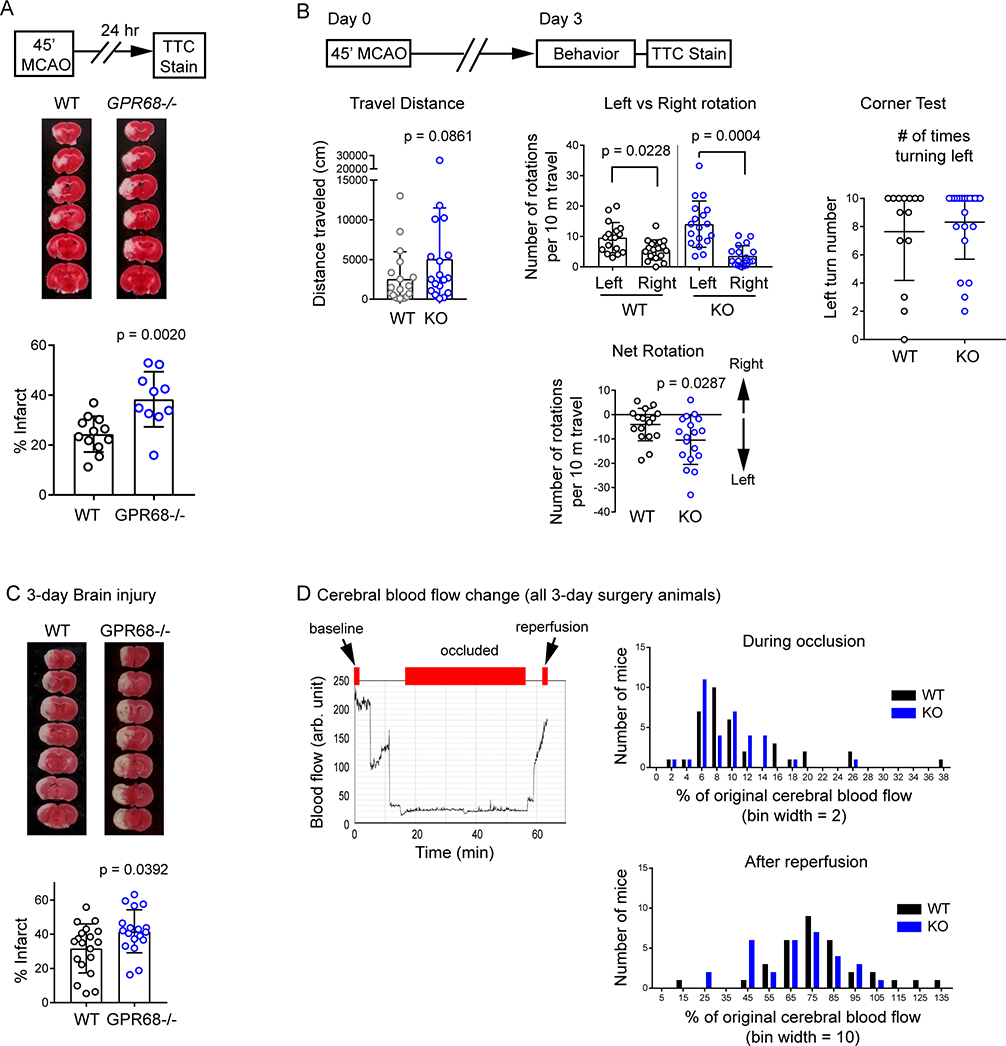
Figure 5. GPR68 deletion worsens ischemia outcome in vivo.
(A) Brain injury following MCAO. Diagram on top right illustrates the MCAO procedure. Bottom panels show representative images and quantification of brain infarct in WT and GPR68−/− (KO) at 24 hr after MCAO. WT and KO animals were subjected to 45 min MCAO. Brain injury was analyzed by TTC staining. (B) Behavioral outcome at 3-day after MCAO. Diagram illustrates the experimental outline. On the third day after MCAO, locomotion of the mouse in a home cage was recorded for 90 min with an infrared based SmartCage, followed by the corner test. The animals were euthanized at 72 hr after MCAO, and brain injury was analyzed by TTC staining. Left panel shows the quantification of Travel Distance during the 60 (from 31 to 90 min) min recording. Middle panel shows rotation (entire 90 min) per 10 m traveled. For net rotation plot, positive and negative values indicate right and left rotations, respectively. See Supplemental Methods for details. Right panel shows the average number of left turns (in 10 trials) in the corner test. (C) Representative TTC stain and quantification of infarct percentage in WT and KO animals. (D) Cerebral blood flow during occlusion and after reperfusion. Graph on the left shows a typical blood flow trace from the MCA territory, monitored with a laser doppler flowmetry. Red bars on top illustrate the window used to calculate the starting (0–1 min, set as 100%), occluded (6th min- the end of occlusion), and reperfusion (last 1 min) of the blood flow. Histograms on the right show the distribution of blood flow changes for all animals where a successful occlusion was achieved (i.e., suture reached the MCA position), which include both the animals met and those which did not meet the inclusion criteria for subsequent injury analysis (see Methods). Histograms were not different when compared for mean (Mann-Whitney U test) or frequency distribution (Kolmogorov-Smirnov test). p values were from 2-tailed t-test or Mann-Whitney U test as described in text.

