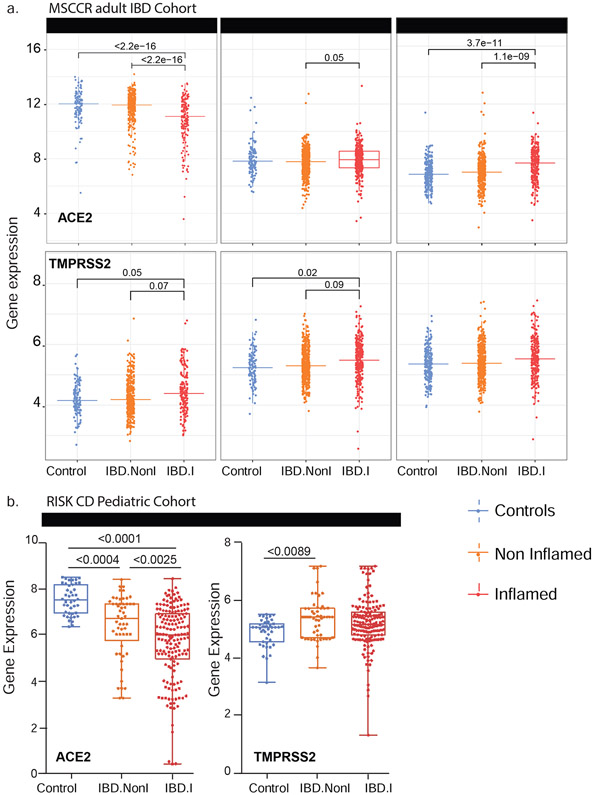
Figure 2: Expression of ACE2 and TMPRSS2 in intestinal biopsies of adult and pediatric IBD patients and controls.
(A) Box plot summarizing the normalized expression level of ACE2 (upper panel) and TMPRSS2 (lower panel) as measured in ileum or colonic and rectal biopsies from control and IBD MSCCR patients, which were either endoscopically inflamed (IBD.I) or non-inflamed (Non.I). (B) Box plot summarizing the normalized expression level of ACE2 (left panel) and TMPRSS2 (right panel) as measured in ileum CD samples from the RISK pediatric cohort. Clinical characteristics of MSCCR IBD patients and biopsies are summarized in Table S3 and S4.

