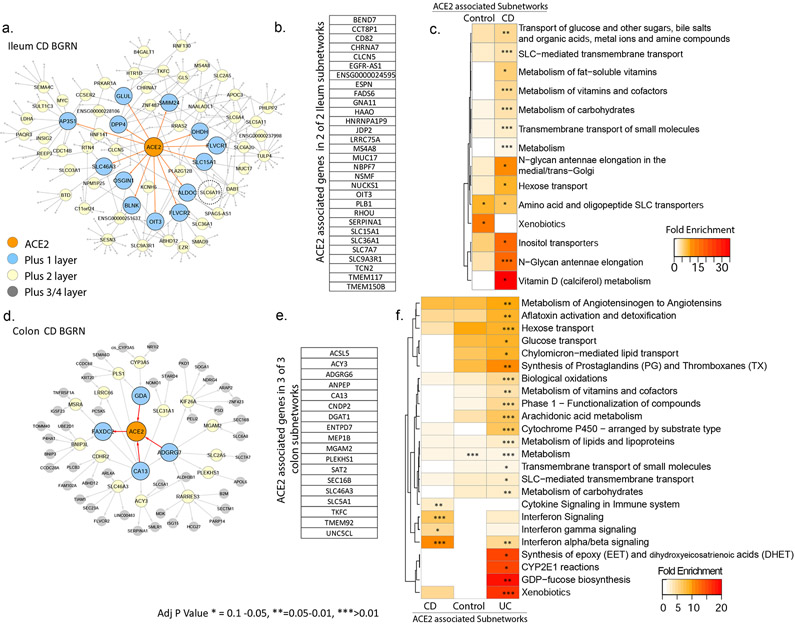
Figure 5: BGRN analysis of ACE2 reveals metabolic function and interferon pathway associations.
The ACE2 associated subnetworks extracted from the A. Ileum CD BGRN (235 of 8458 nodes total) or from the (D) Colon CD BGRN (235 of 8549 total nodes). Genes (nodes) found within the first, second or third/fourth layer are colored blue, yellow or grey, respectively. Five ACE associated subnetworks were generated (Table S7). (B) and (E) A summary of the genes found in both ileum and colon ACE2-associated networks. Subnetwork sizes are: Control_ileum = 221; CD_ileum= 235; Control_colon = 229; CD_colon = 235 and UC_colon = 346. (C) and (F) Reactome pathway enrichment analysis of ACE2-associated subnetworks (with BH adj P <0.1). The heatmap depicts fold enrichment. Level of significance is indicated by either *, ** or *** for p-value of <0.1, <0.05 or <0.01, respectively (Table S8 for full results).

