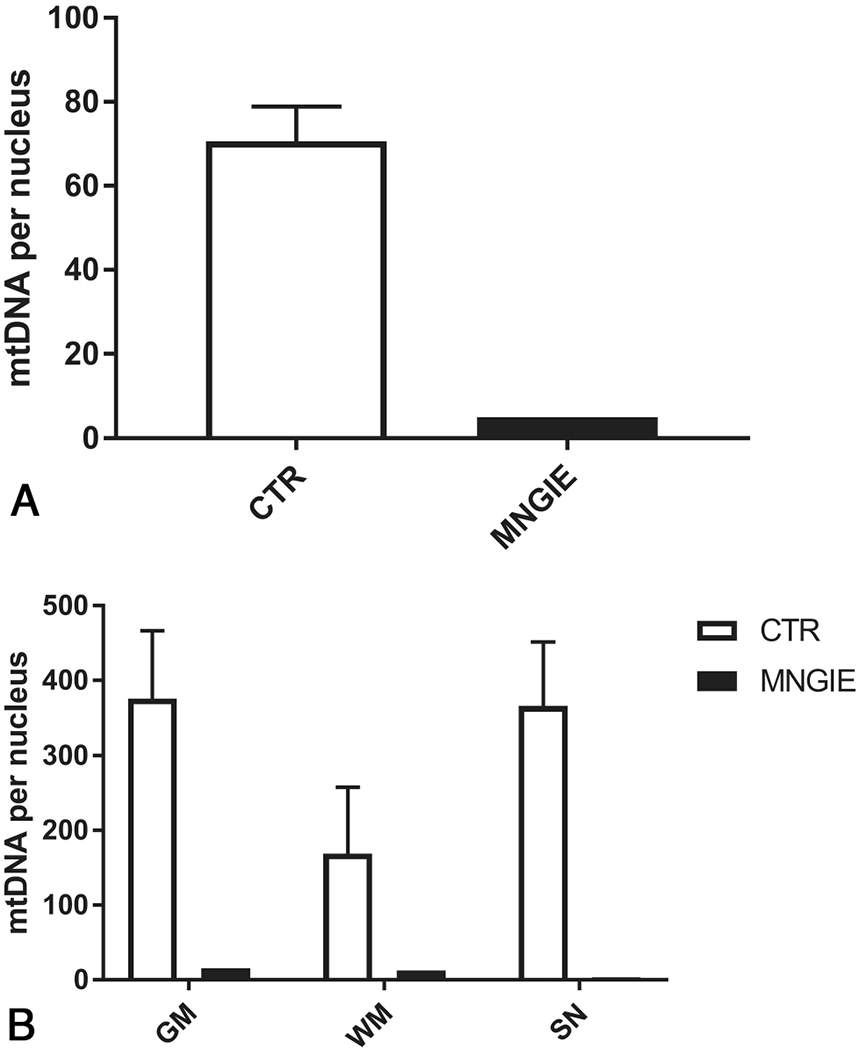
FIG 4.

The mtDNA amount in the brain of patient 7 with MNGIE. A, mtDNA amount in smooth-muscle and endothelial cells microdissected by laser capture from an MNGIE brain and controls (n = 3) (expressed as mtDNA copy per nucleus). B, The mtDNA amount in different cerebral regions microdissected by laser capture from MNGIE and controls (n = 3) (expressed as mtDNA copy per nucleus). SN indicates substantia nigra; CTR, controls.
