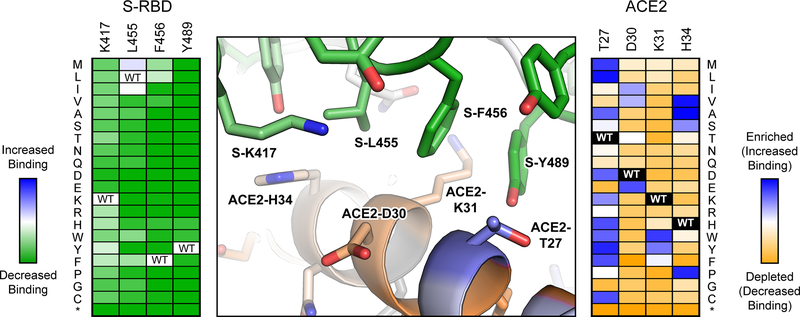
Figure 2. Substitutions at the RBD ACE2 interface have different outcomes on binding.
As determined by yeast display, the effects of mutations in the RBD of SARS-COV-2 protein S on receptor affinity are plotted in the heat map at left, with dark green indicating the mutations are deleterious and pale colors indicating the mutations are neutral. The effects of mutations in human cell-expressed ACE2 on binding to soluble RBD are plotted in the heat map at right, with depleted mutations in orange, neutral mutations in white and enriched mutations in blue. Positional scores are mapped to the atomic structure of RBD-bound ACE2 (PDB 6M17) at center. Conserved ACE2 residues for RBD binding are orange, while ACE2 residues that are hot spots for mutations with increased affinity are blue. RBD residues conserved for ACE2 binding are green. Most RBD mutations in this region of the interface are deleterious, whereas numerous mutations were found in ACE2 that increased affinity.

