Fig. 5:

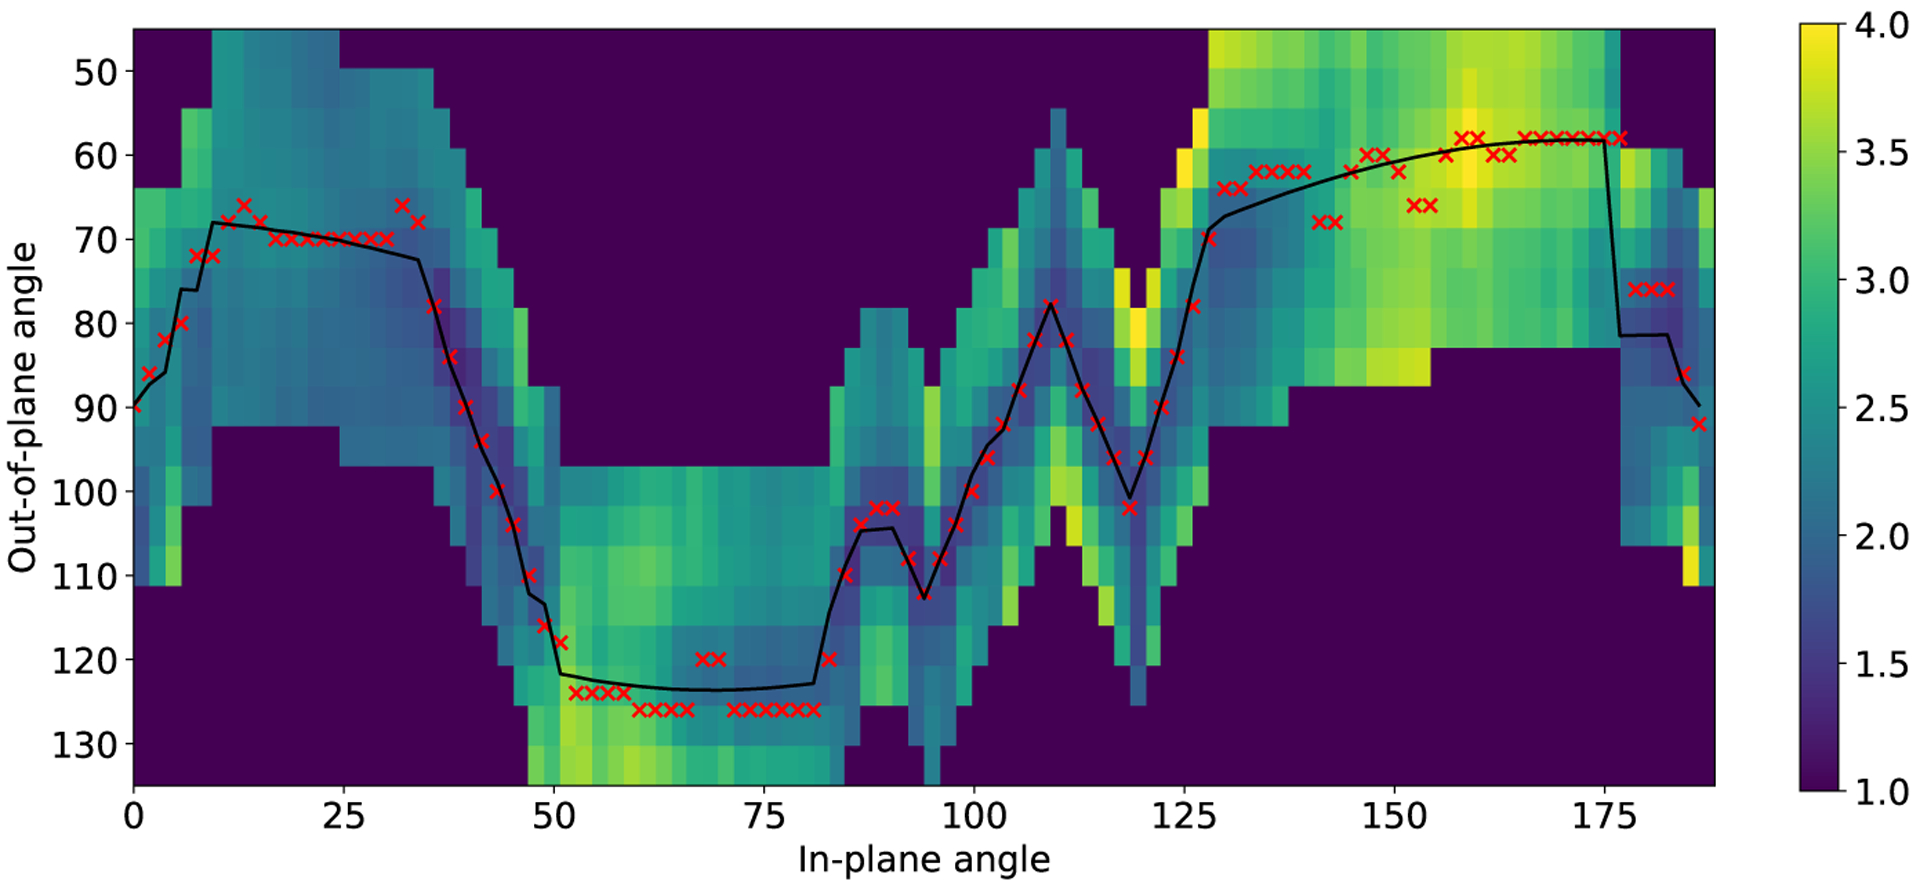
Predicted trajectory on real data in black and network predictions relative to the current position. The crosses show optimal views based on network output, the black line is the final trajectory based on the closest sampled view.

Predicted trajectory on real data in black and network predictions relative to the current position. The crosses show optimal views based on network output, the black line is the final trajectory based on the closest sampled view.