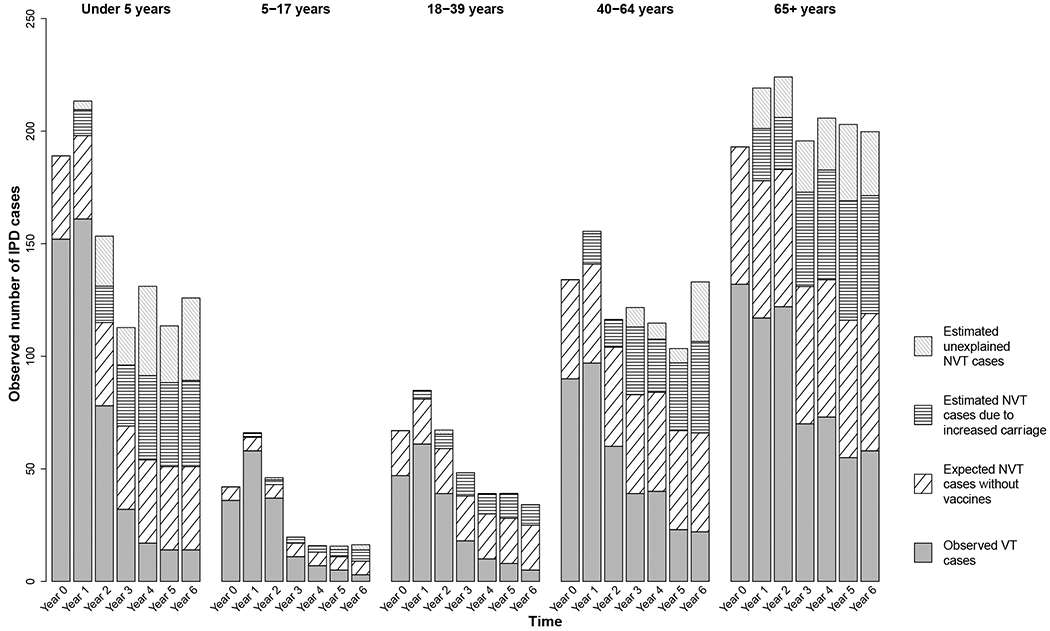
Figure 3. Estimated additional cases gained as a result of increased carriage in children under 5 in Israel, July 2009-July 2016.

Results are shown for each age group and year of the study. Each full bar represents the total number of observed IPD cases for that stratum. The different patterned portions of the bars denote the fraction of total cases attributable to different groups of serotypes: observed vaccine-targeted (VT) serotype cases (solid gray), expected non-vaccine-targeted (NVT) serotype cases had PCV13 not been introduced (diagonal black lines), estimated additional cases gained as a result of increased carriage in children, explained by this model (horizontal black lines), and estimated additional cases gained that are not explained by this model (gray diagonal gray lines).
