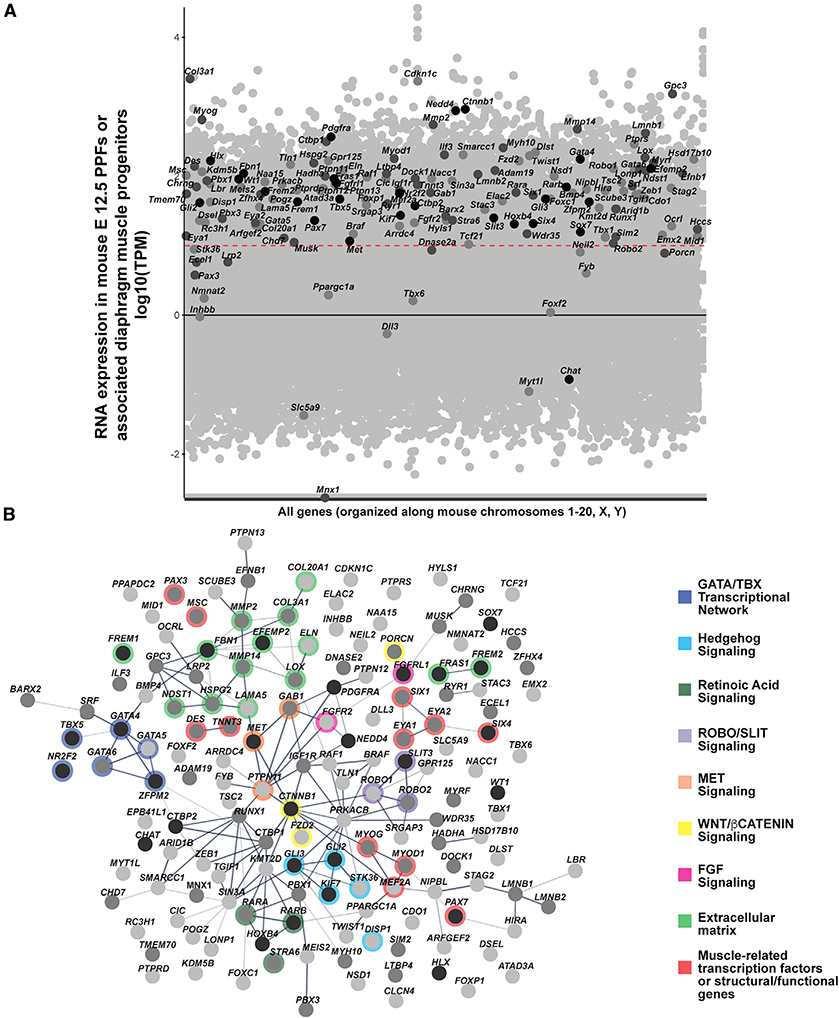
Figure 1. Genes associated with CDH in the literature were collected and ranked based on the amount of human CDH individual and mouse model functional evidence (see Table S1 for rankings).
(A) CDH-associated genes overlaid on all genes expressed in mouse PPFs at E12.5. RNA-seq reads normalized using TPM. Black line denotes TPM = 0, and red dashed line denotes TPM = 10 (Log1). Black dots, CDH genes highly supported by human and mouse data; dark gray dots, genes with moderate data support; light gray dots, CDH genes with modest data support.
(B) STRING protein network of CDH-associated genes. Within the STRING tool all active interaction sources except text-mining were used, with a minimum required interaction score of 0.4. Edges are based on the strength of data support. Nodes without edges are genes that do not interact with any other listed genes. Thick edges, interaction score > 0.9; thinner edges, 0.9–0.7 interaction score; thinnest edges, interaction score < 0.4. Prominent GATA/TBX transcriptional network, extracellular matrix, and muscle-related genes are highlighted as well as Hedgehog, Retinoic Acid, ROBO/SLIT, MET, WNT/β-CATENIN, and FGF signaling pathways. In both RNA-seq expression and protein network genes ranked 1–27 (with a total score of ≥ 10) are shown in black, genes ranked 28–88 (with a total score 5–9) are shown in dark gray, and genes ranked 89–153 (with a total score < 5) are shown in light gray. Details on rankings are described in Table S1 and Material and methods.

