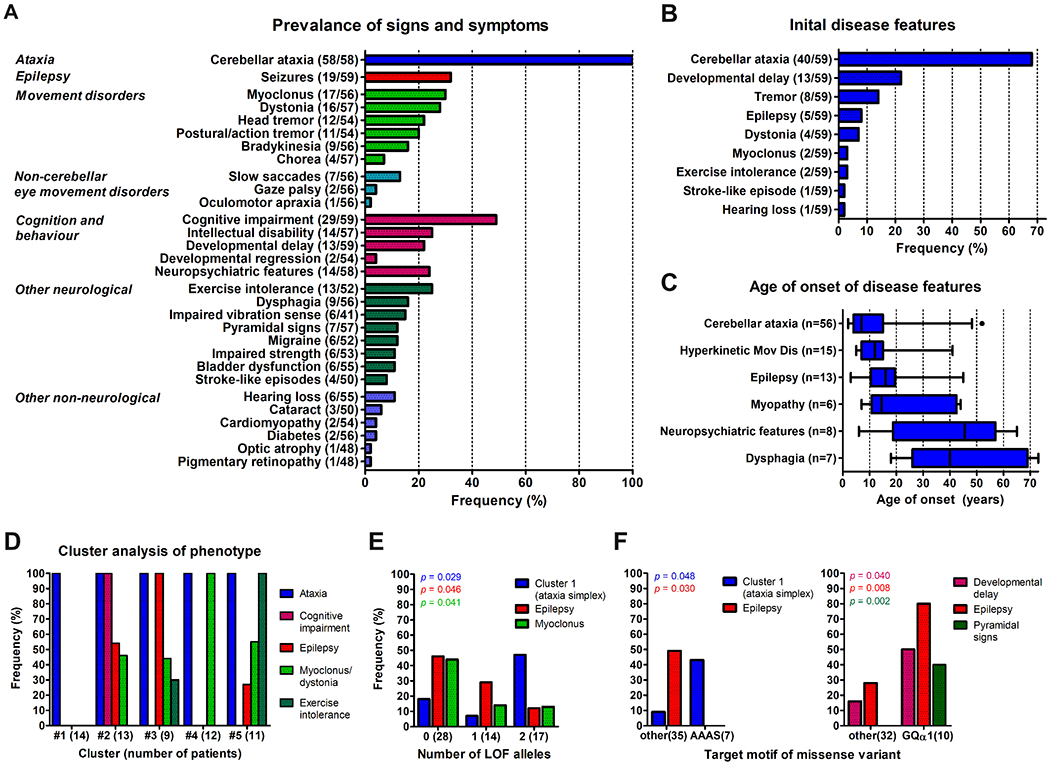
Figure 3: Phenotypic spectrum of COQ8A-ataxia.

(A) Prevalence of signs and symptoms in patients with COQ8A mutations (n = 59). Numerator and denominator in brackets indicate the number of affected patients and the number of patients assessed for this feature, respectively. (B) Frequency of initial features at disease onset. 13/59 patients had more than one feature at onset. Note that cerebellar ataxia was only present in 68% at disease onset. (C) Age of onset of disease features. Number of affected patients in brackets. Box-whisker plots representing median, interquartile range and 95% confidence interval. (D) Frequency of the most prevalent features in five clusters identified by a two-step cluster analysis. Note cluster 1 comprising of 14 patients (24%) with a cerebellar ataxia phenotype, but none of the other four prevalent features (“ataxia simplex” cluster), and cluster 4 comprising of 12 patients (20%) with ataxia and only myoclonus or dystonia. (E, F) Genotype-phenotype associations. Frequency of clinical features stratified by the number of loss of function (LOF) alleles (E), and by clusters of missense variants in specific COQ8A motifs (F). p values represent results from Fisher’s exact tests.
