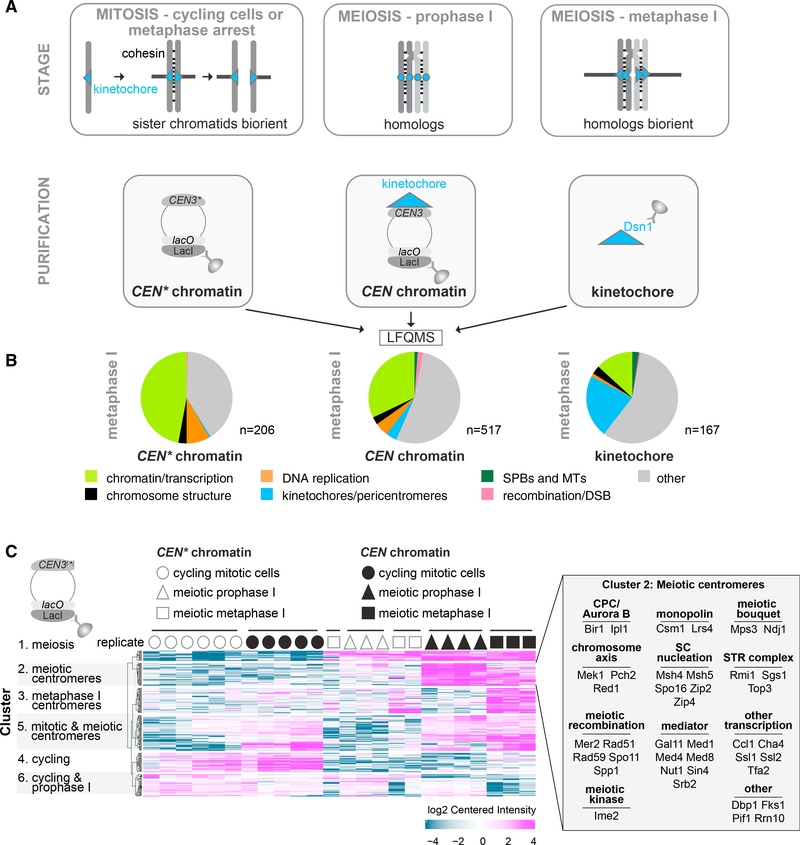
Figure 1. Quantitative Label-Free Mass Spectrometry (LFQMS) Reveals the Complexity of the Centromere and Kinetochore-Associated Proteomes.
(A) Schematic representation of determined proteomes. CEN chromatin, CEN* chromatin, and kinetochores were isolated from cycling, prophase I-arrested, and metaphase I-arrested cells and subjected to LFQMS.
(B) CEN* chromatin, CEN chromatin, and kinetochores show respective increases and decreases in the fraction of enriched proteins that are associated with chromatin or kinetochores. Following immunoprecipitation of LacI-3FLAG (CEN chromatin and CEN* chromatin) and Dsn1–6His-3FLAG (kinetochores), proteins were quantified using LFQMS, and those enriched over respective negative controls with a cut-off of Log2(fold change) > 4 and p < 0.01 were categorized in the indicated groups.
(C) Stage-specific functional groups of proteins associating with CEN chromatin and CEN* chromatin. k-means clustering with a cut-off of Log2(fold change) > 2 and p < 0.05 was used. Cluster 2 proteins are listed in the inset.
See also Table S1.

