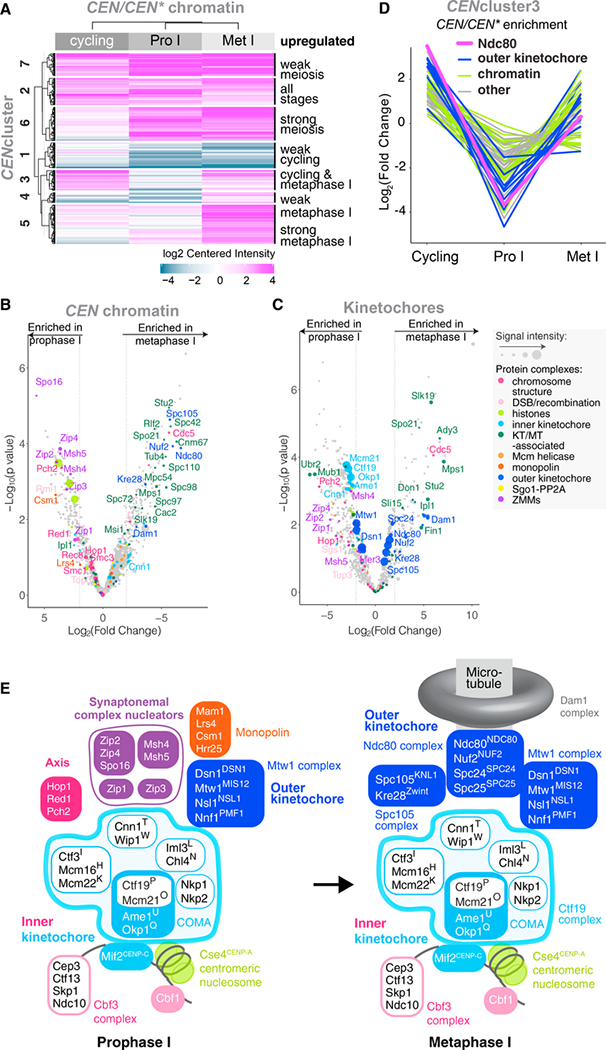
Figure 2. Changes in the Centromeric and Kinetochore Proteomes between Meiotic Prophase I and Metaphase I.
(A) CEN chromatin exhibits distinct composition signatures at different stages. The CEN chromatin/CEN* chromatin enrichment values for each of cycling, prophase I-arrested, and metaphase I-arrested conditions were clustered (k-means) to identify groups of proteins with similar behavior. A cut-off of Log2(fold change) > 2 and p < 0.05 was used.
(B and C) Composition of CEN chromatin (B) or kinetochore particles (C) isolated from prophase I and metaphase I is strikingly different. Volcano plot presenting the LFQMS-identified proteins co-purifying with CEN plasmids (B) or Dsn1–6His-3FLAG (C) immunopurified from cells arrested in prophase I (ndt80Δ, B; inducible-NDT80, C) and metaphase I (pCLB2-CDC20). Log2(fold change) between conditions is shown with corresponding p values (STAR Methods). Dashed line indicates |Log2(fold change)| = 2.
(D) Several proteins exhibit Ndc80NDC80-like depletion from centromeres specifically during meiotic prophase. Mean-centered Log2(fold change) from CEN-cluster3 is plotted to show abundance of individual proteins in the indicated stages.
(E) Schematic illustrating changes in the kinetochore association of some key complexes between meiotic prophase I and metaphase I observable by proteomics.
See also Figures S1 and S2 and Tables S2 and S3.

