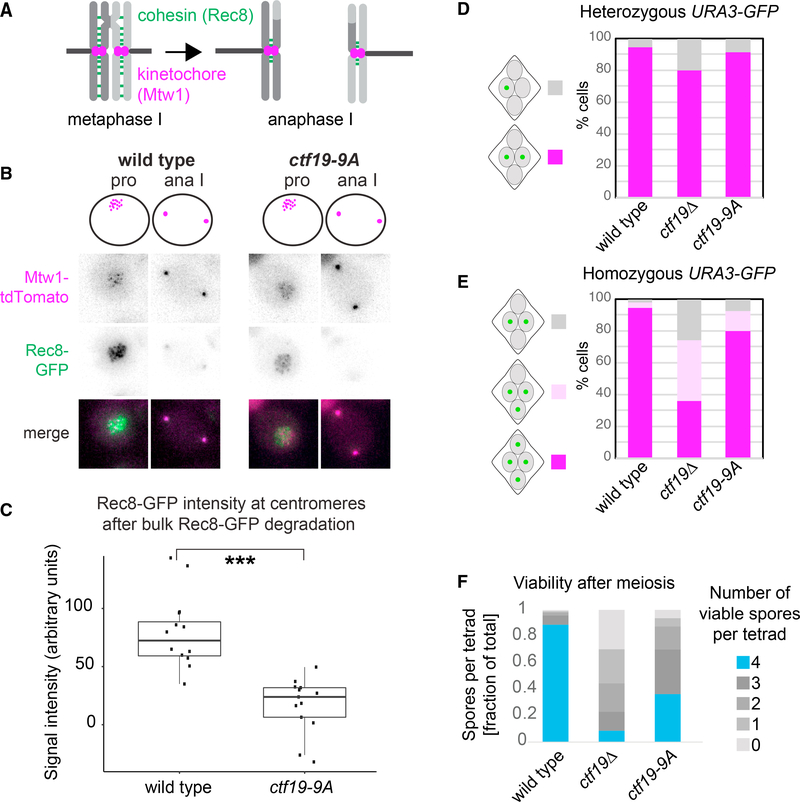
Figure 3. Pericentromeric Cohesion Is Absent in ctf19-9A Anaphase I Cells.
(A–C) Pericentromeric cohesin is reduced in ctf19-9A anaphase I cells. Wild-type and ctf19-9A cells expressing Rec8-GFP and Mtw1-tdTomato were imaged throughout meiosis.
(A) Schematic showing Rec8REC8 loss from chromosome arms, but not pericentromeres in anaphase I.
(B) Representative images are shown.
(C) Quantification of Rec8-GFP signal in the vicinity of Mtw1-tdTomato foci immediately following bulk Rec8-GFP degradation. Whiskers represent 1.5 IQR(interquartile range), the middle line is median, and the box encompasses two middle quartiles of the data. ***p < 10−5; Mann-Whitney test. n > 11 cells.
(D and E) ctf19-9A cells show less severe meiosis II chromosome segregation defects than ctf19Δ cells. The percentage of tetra-nucleate cells with the indicated patterns of GFP dot segregation was determined in wild-type and ctf19-9A cells with either one copy (heterozygous, D) or both copies (homozygous, E) of chromosome V marked with GFP at URA3 locus. n = 2 biological replicates, 100 tetrads each; mean values are shown.
(F) Spore viability of ctf19-9A cells is impaired, but less severe than ctf19Δ cells. The number of viable progeny was scored following tetrad dissection. n = 3 biological replicates, >70 tetrads each; mean values are shown.
See also Figure S3.

