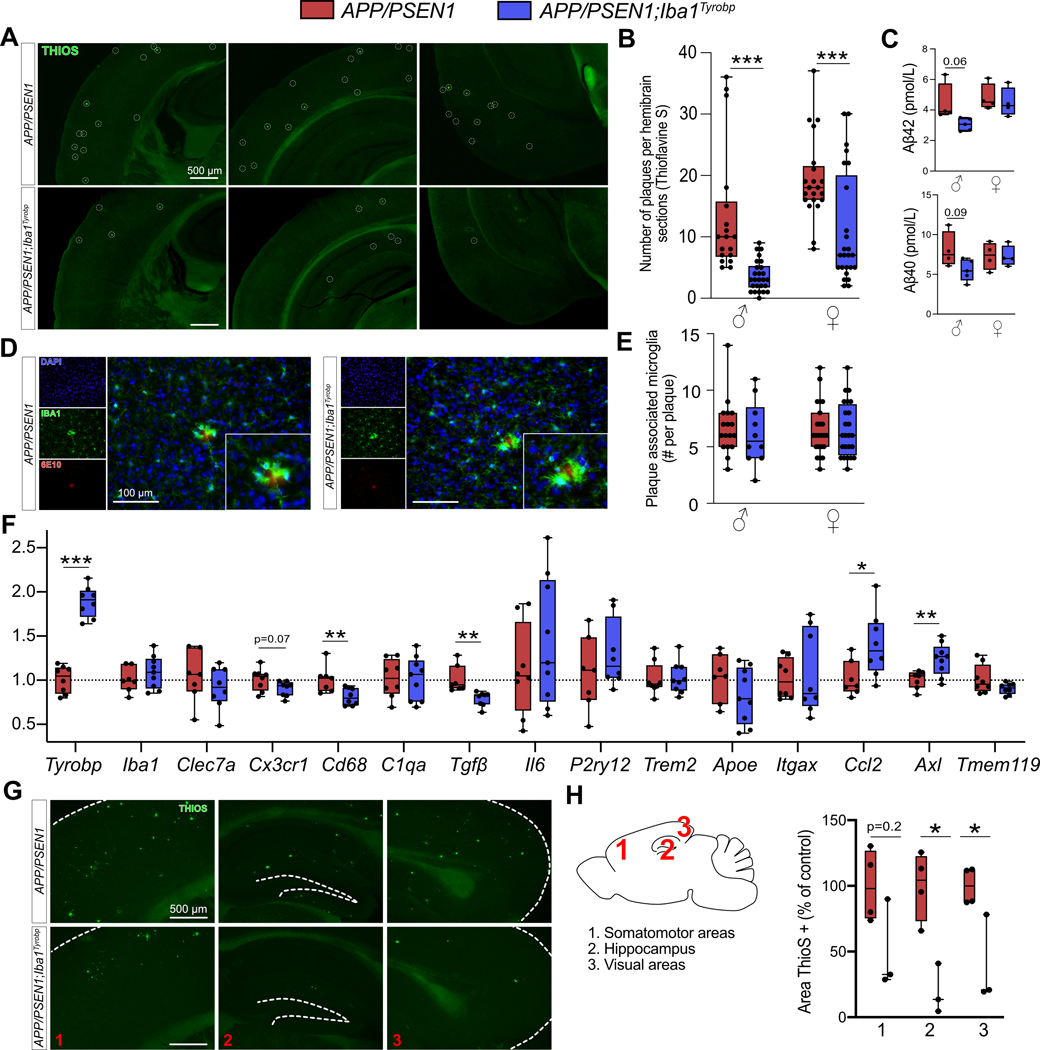
Figure 3: Transgene-derived Tyrobp upregulation decreases amyloid plaque load in APP/PSEN1 mice.
(A) Representative images of Thioflavine-S (ThioS) staining in APP/PSEN1 and APP/PSEN1;Iba1Tyrobp mice at 4 months of age. Scale bar = 500 μm. (B) Quantification of the number of ThioS-positive plaques per hemibrain in APP/PSEN1 and APP/PSEN1;Iba1Tyrobp mice at 4 months of age. N = 4–5 mice per genotype and sex with 3 slices per animal. (C) Human Aβ42 and Aβ40 concentrations measured by ELISA in the cortices of the same groups described in (B). (D) Representative images of double-label immunohistochemistry with anti-IBA1 and anti-6E10 antibodies in APP/PSEN1 and APP/PSEN1;Iba1Tyrobp mice at 4 months of age. Scale bar = 100 μm. (E) Quantification of the number of plaque-associated microglia in the 4 groups described in (B). N = 10–24 plaques from 4–5 mice per group. (F) RT-qPCR analyses of microglial gene mRNAs in the hippocampi of APP/PSEN1 and APP/PSEN1;Iba1Tyrobp mice at 4 months of age. N = 7–9 mice per group, females and males were pooled. (G) Representative images of ThioS staining in male APP/PSEN1 and APP/PSEN1;Iba1Tyrobp mice at 8 months of age. Scale bar = 500 μm. (H) Quantification of the ThioS immunoreactive area in male APP/PSEN1 and APP/PSEN1;Iba1Tyrobp mice at 8 months of age (somatomotor and visual areas of the cortex, and hippocampus were quantified). N = 3–4 mice per group. Error bars represent means ± SEM. Statistical analyses were performed using a Two-Way ANOVA followed by a Sidak post-hoc test for (B and E), a Kruskal-Wallis test for (C), a Student t-test for (F) and a Mann-Whitney test for (H), *p<0.05, **p<0.01, ***p<0.001.

