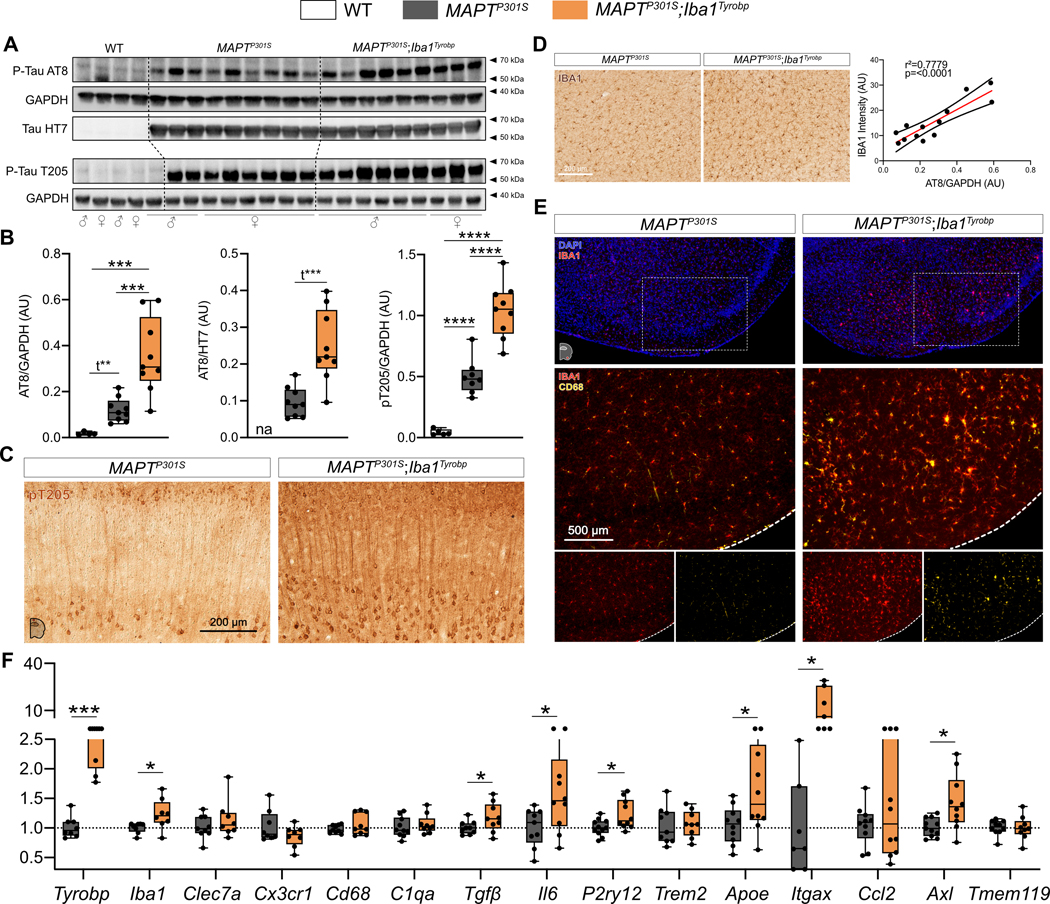
Figure 4: Transgene-induced Tyrobp upregulation increases apparent stoichiometry of TAU phosphorylation and microglial activation in 4-month-old MAPTP301S mice.

(A) Western blot analyses of phosphorylated-TAU on S202 or T205 epitopes (AT8 and pT205 antibodies) and total human TAU (HT7 antibody) in cortical homogenates from WT, MAPTP301S (PS19) and MAPTP301S;Iba1Tyrobp mice at 4 months-old. n = 4–9 mice per group. (B) Densitometric analyses of western blots presented in (A) standardized to GAPDH or HT7. (C) Representative images of DAB-immunohistochemistry with antibody pT205 in 4 month-old MAPTP301S and MAPTP301S;Iba1Tyrobp mice. Scale bar = 200 μm. (D) Left panel: representative images of anti-IBA1 immunohistochemistry on the same groups described in (C). Scale bar = 200 μm. Additional representative pictures are presented in Supplementary Figure 2. Right panel: western blot-AT8/GAPDH quantification plotted against anti-IBA1 immunoreactivity in the cortex. Linear regression with trend line (red line) and 95% confidence intervals (black lines) are indicated. (E) Representative images of double-label immunofluorescence with anti-IBA1 and anti-CD68 antibodies in the piriform cortex on the same groups described in (C). Scale bar = 500 μm. (F) RT-qPCR analyses of microglial gene mRNAs in the hippocampus of MAPTP301S and MAPTP301S;Iba1Tyrobp mice at 4 months of age. N = 7–11 per group. Error bars represent means ± SEM. Statistical analyses were performed using a One-Way ANOVA followed by a Tukey’s post-hoc test for (B) or a Student t-test for (B) when *t is indicated and (F), *p<0.05, **p<0.01, ***p<0.001, ****p<0.0001.
