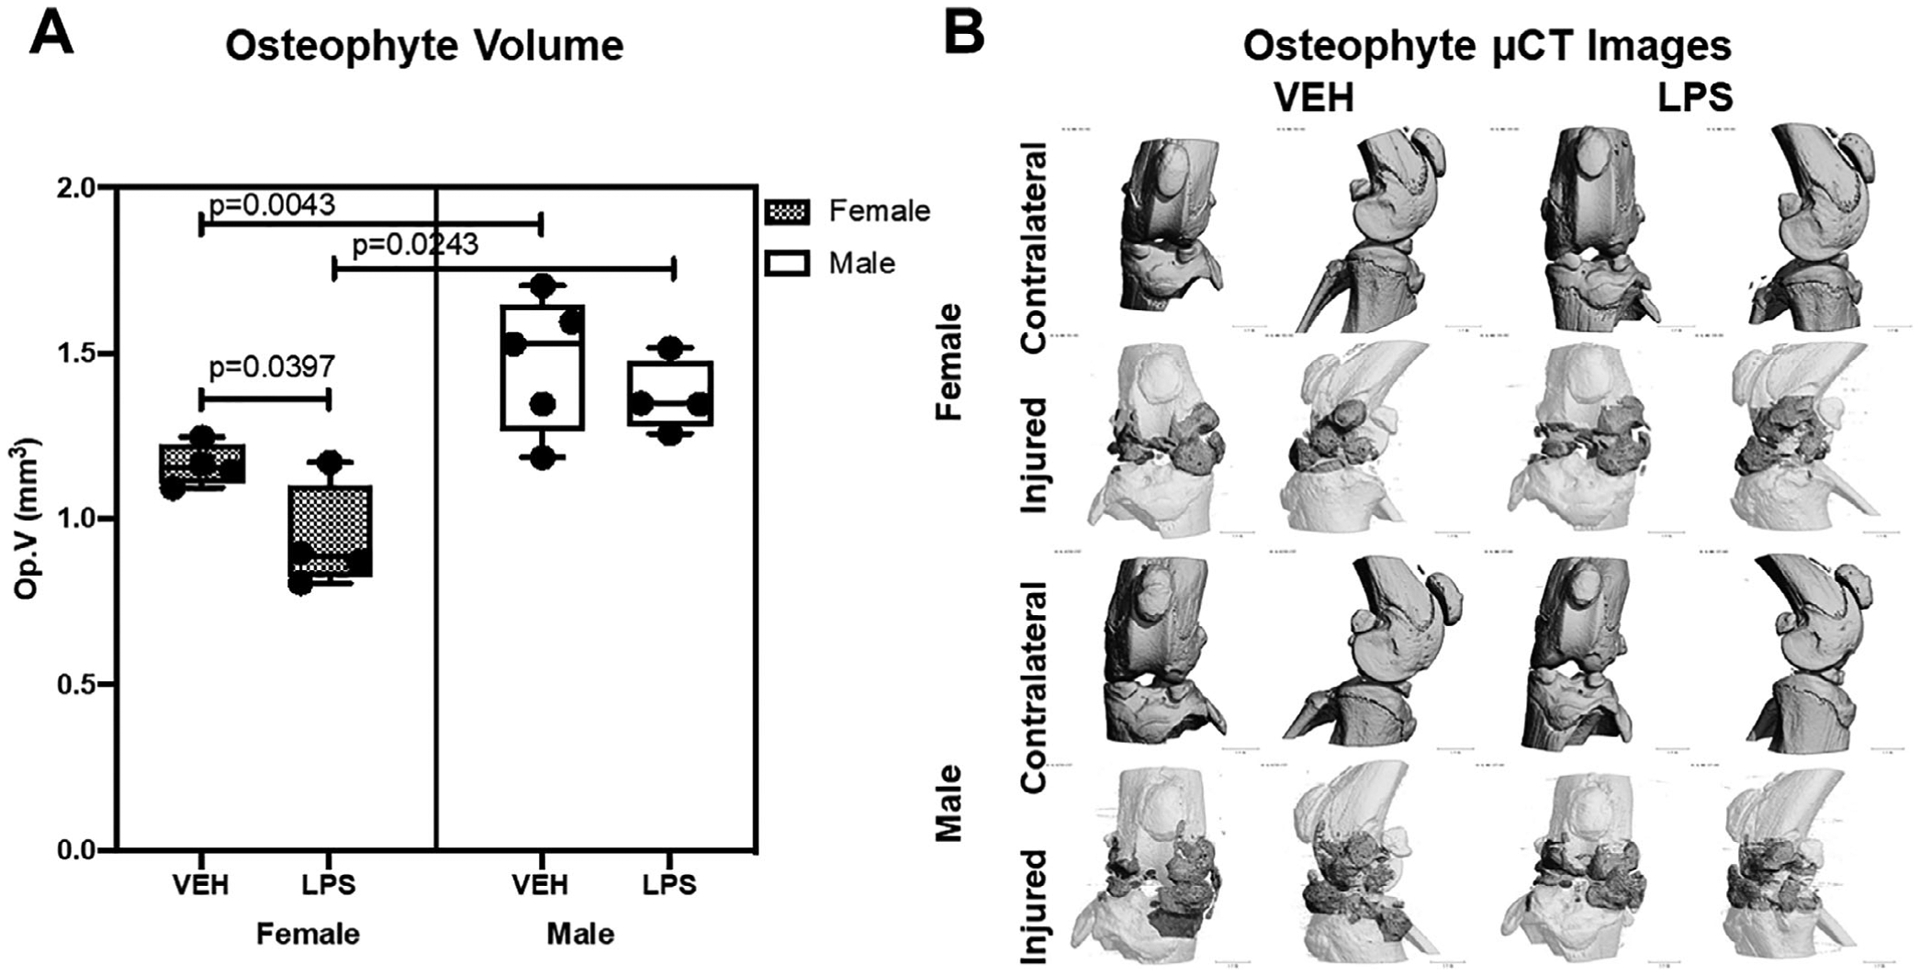
Fig 3.

Osteophyte representation using micro-computed tomography. (A) There was significantly lower osteophyte volume on the VEH females compared with the males. There was significantly lower osteophyte volume on the LPS females than the VEH females. (B) Micro-computed tomography reconstructions of representative joints from all groups. For injured joints, dark gray regions show osteophyte growth compared with the native bone (white).
