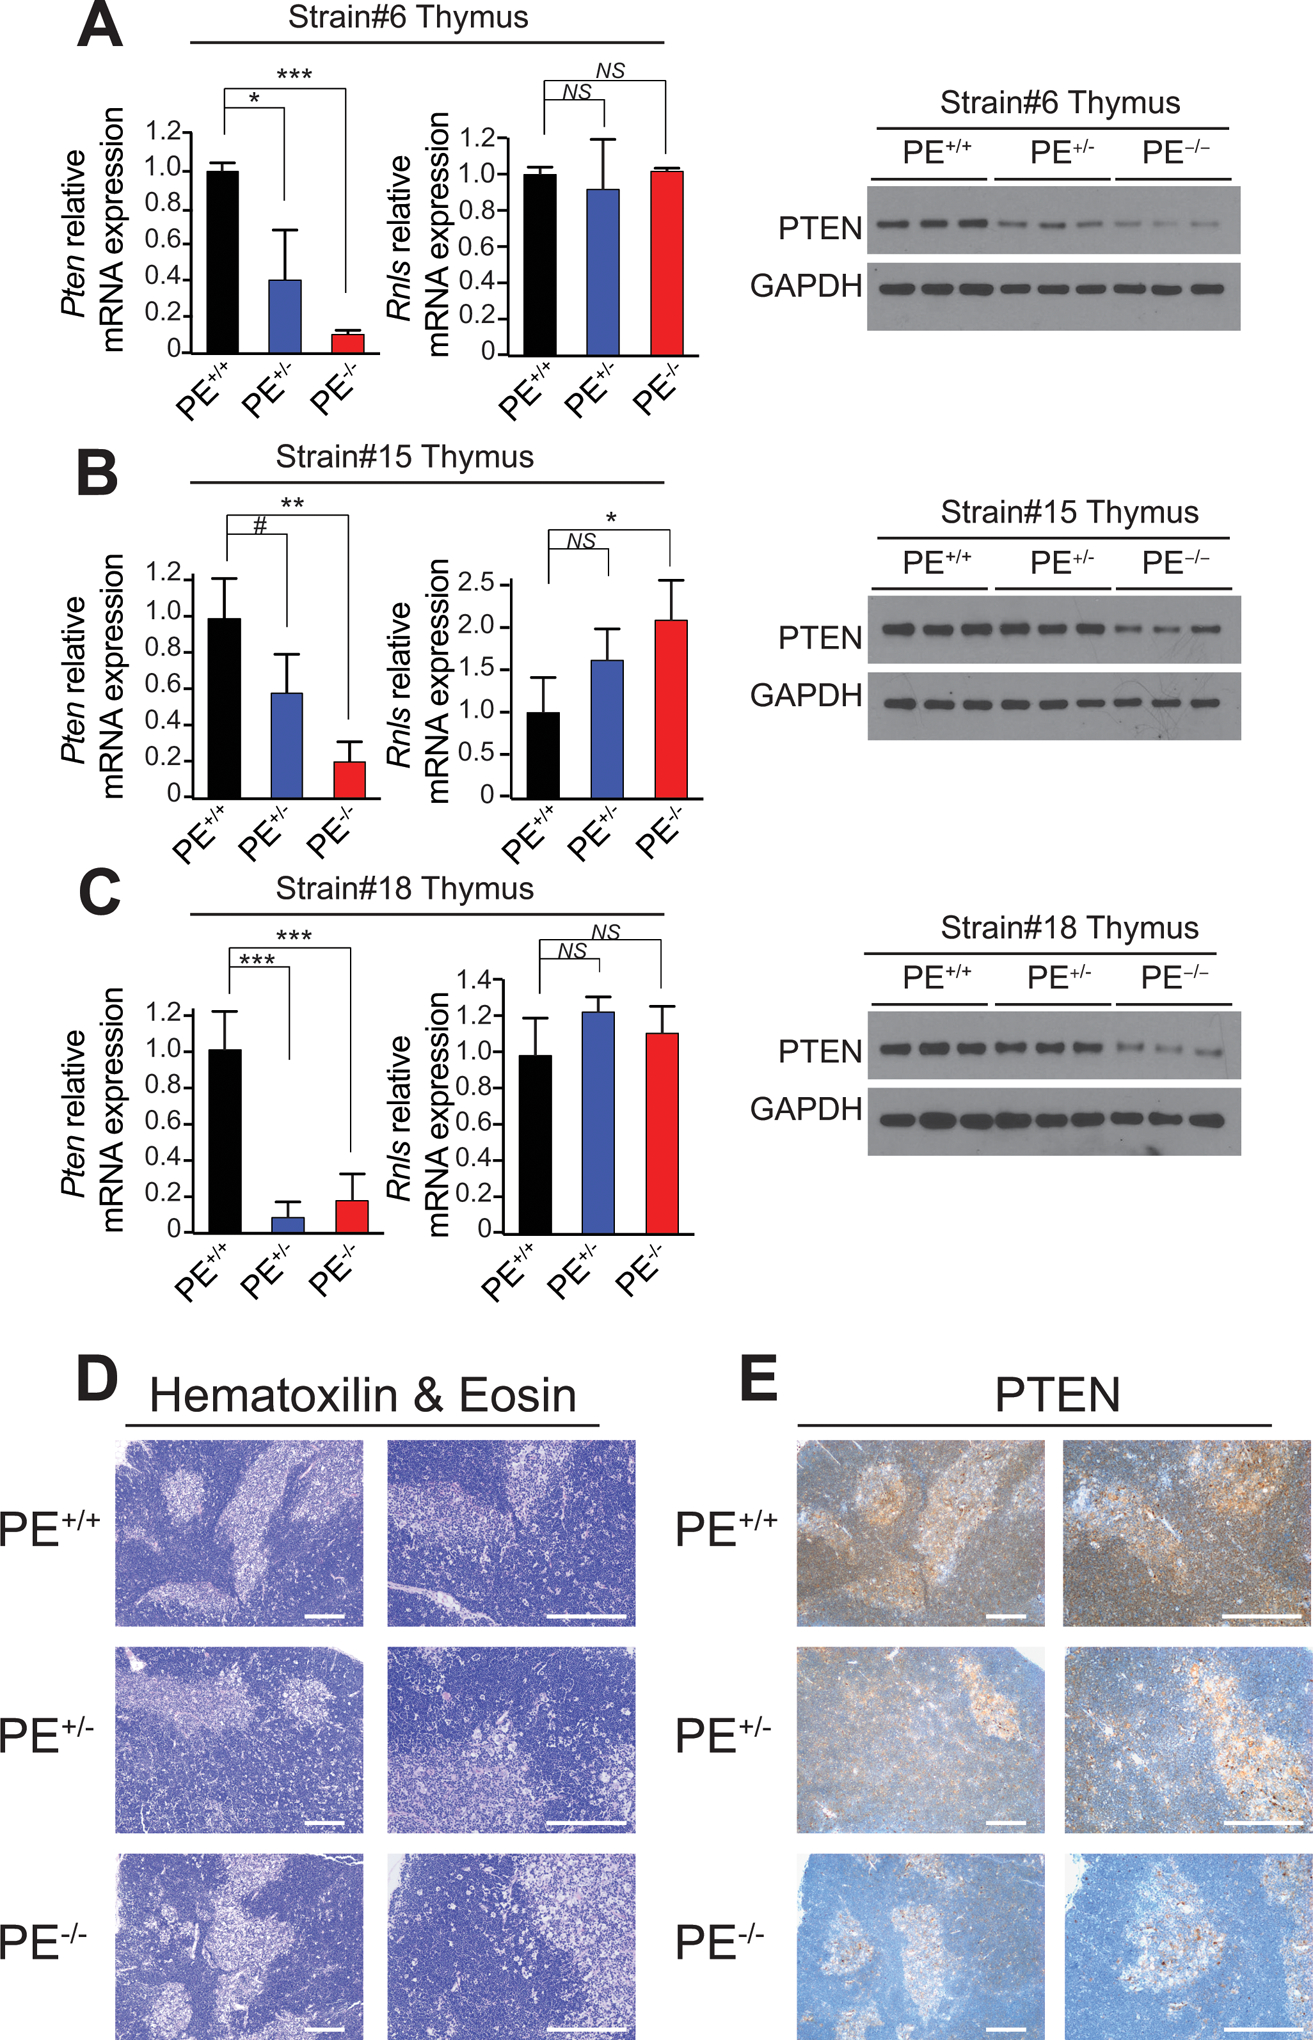
Figure 3.

PE-deficient mice show reduced Pten levels in the thymus. A-C, Pten and/or Rnls mRNA and protein levels in thymi from PE+/+, PE+/− and PE−/− mice (n = 3 per genotype) from strain #6 (A), #15 (B) or #18 (C). #P < 0.1; *P < 0.05; **P < 0.01; and ***P < 0.005 values calculated using two-tailed Student’s t-test. NS = not significant. D-E, Hematoxilin & Eosin (D) and PTEN (E) staining in thymi from PE+/+, PE+/− and PE−/− mice (strain #6). Scale bars = 50μm.
