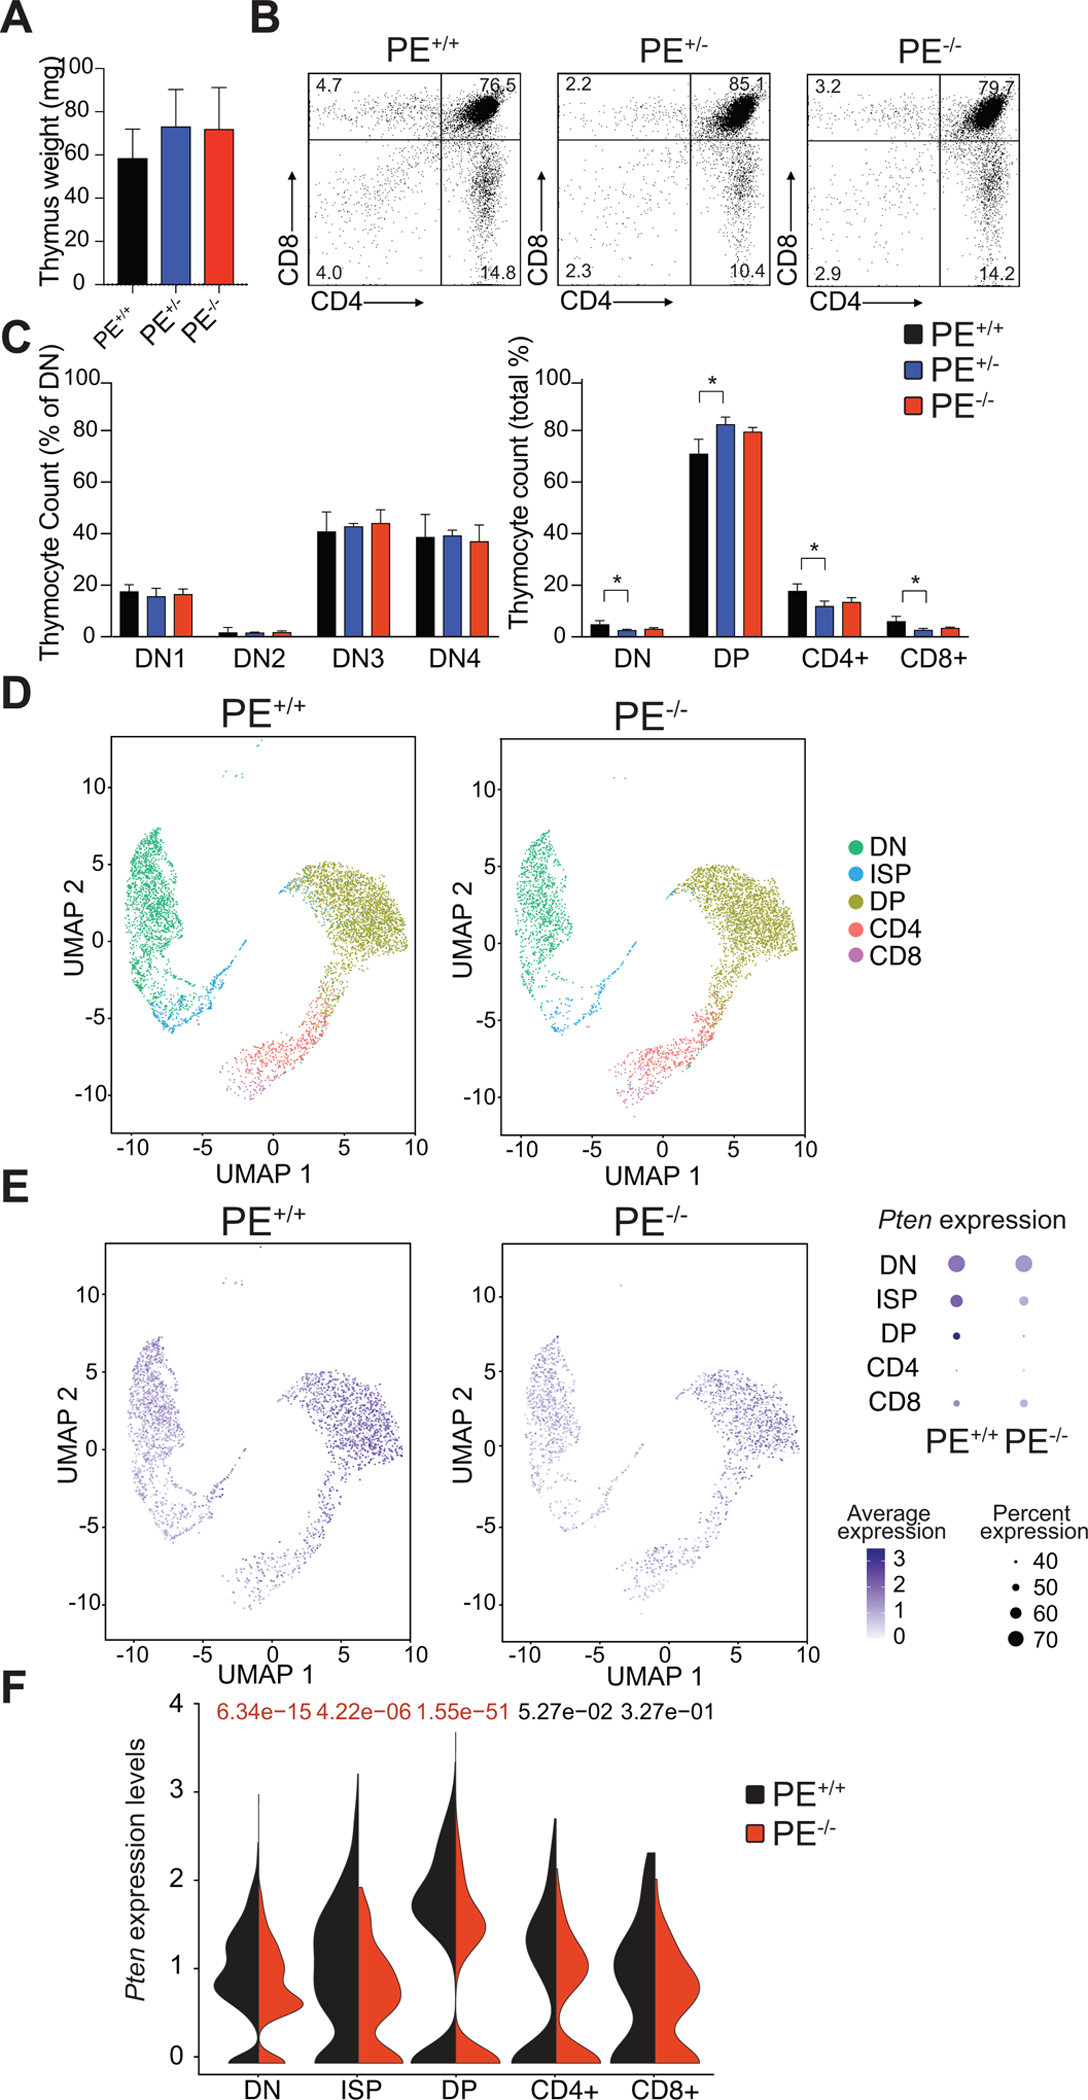
Figure 4.

Effects of PE loss in thymic T-cell development. A, Thymus weight in 6-week-old wild- type (PE+/+), PE heterozygous knockout (PE+/−) and PE homozygous knockout (PE−/−) mice (n = 3 per genotype). B, Representative flow cytometry plots of thymocyte populations stained with antibodies to CD4 and CD8 in PE wild-type, PE heterozygous knockout and PE homozygous knockout 6-week-old mice. Percentage populations are indicated in each quadrant. C, Quantification of intrathymic T-cell populations in PE wild-type, PE heterozygous knockout and PE-null mice in relative numbers. Significance was calculated using two-tailed Student’s t-test (*P< 0.05; all other comparisons not significant). D, Single-cell RNA-seq analysis of a 1:1 mix of total thymocytes and CD4−CD3− thymocytes from 6-week-old PE wild-type and PE homozygous knockout mice. UMAP embeddings show the cells annotated to each thymic population. E, UMAP embeddings as in D representing single-cell Pten expression. Dot plots (right) represent the expression of Pten. Size of the dots is proportional to the percentage of cells expressing Pten in each population; color of the dots represents Pten average expression. F, Violin plots represent the expression of Pten in the different thymic populations. Significance was calculated using the Wilcoxon rank-sum test (significant values shown in red).
