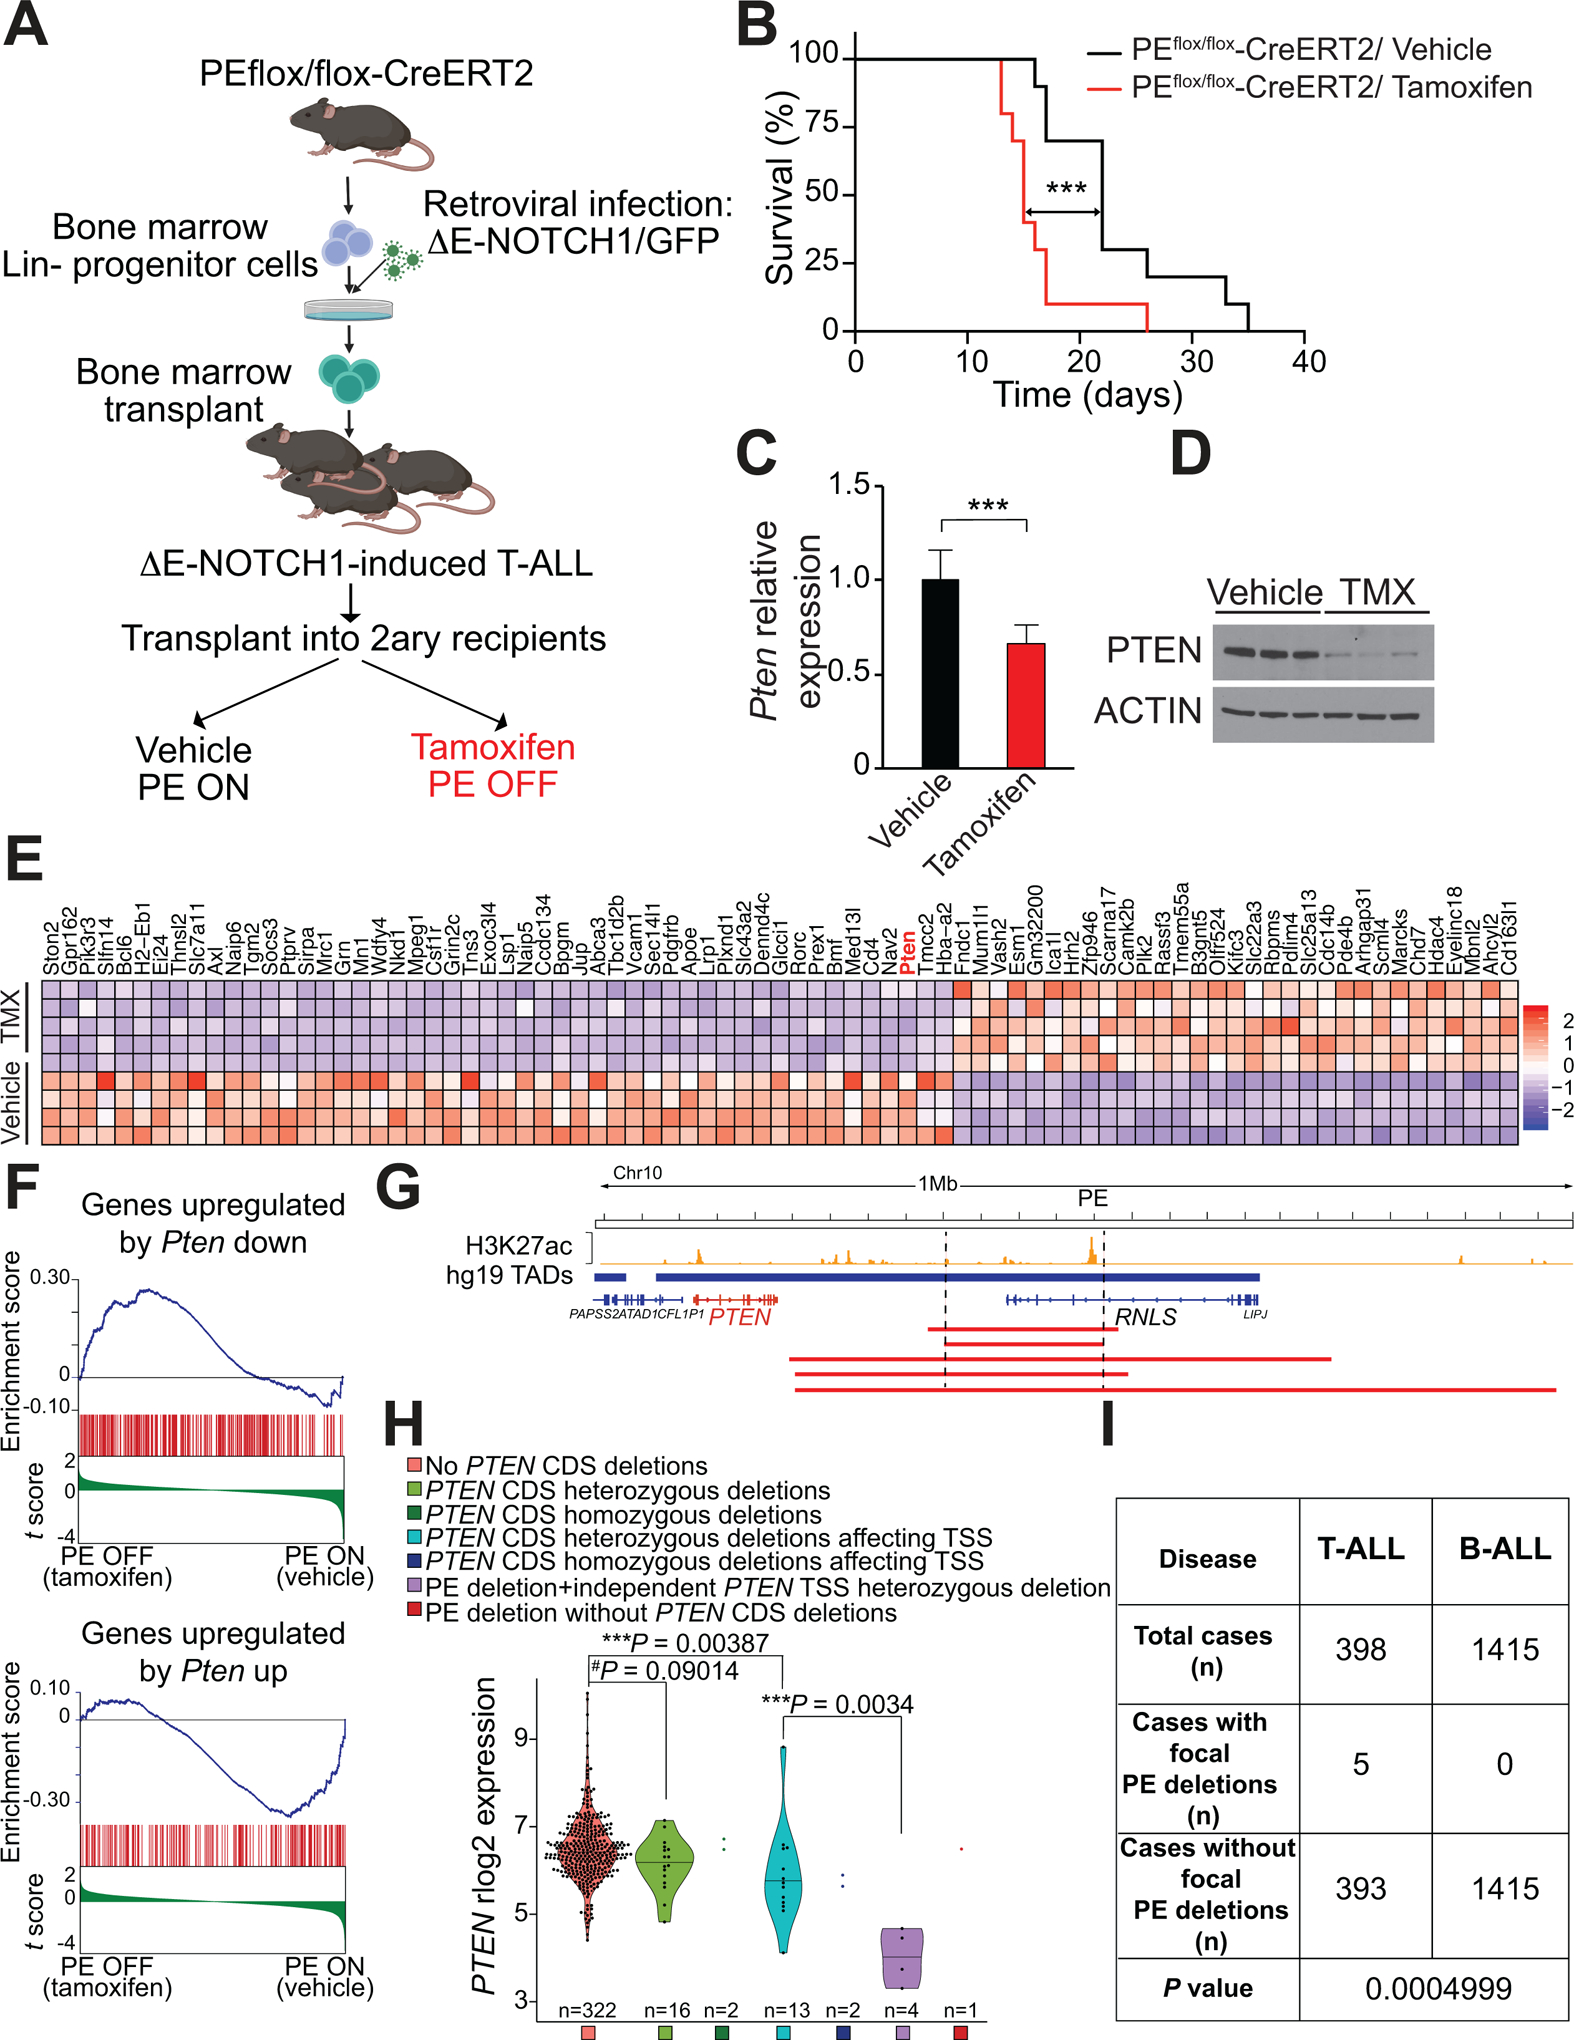
Figure 6.

Secondary loss of PE leads to accelerated NOTCH1-induced T-ALL progression and reduced levels of PTEN in mouse and human T-ALL. A, Schematic of retroviral-transduction protocol or the generation and analysis of PE conditional knockout NOTCH1-induced T-ALL. B, Kaplan-Meier curves of mice transplanted with PE conditional knockout ΔE-NOTCH1-induced T-ALL and treated in vivo with vehicle (control) or tamoxifen, to induce isogenic deletion of PE. ***P ≤ 0.005 values calculated using the log-rank test. C, Quantitative RT-PCR analysis of Pten expression in tumor cells isolated from PE conditional knockout leukemia–bearing mice treated with vehicle only (n = 7) or tamoxifen (n = 8) in vivo. Graph show the mean values, and the error bars represent the s.d. ***P ≤ 0.005 was calculated using two-tailed Student’s t test. D, Western blot analysis of PTEN expression in tumor cells isolated from PE conditional knockout leukemia–bearing mice treated with vehicle only (n =3) or tamoxifen (n = 3) in vivo. E, Heat map representation of the top 81 differentially expressed genes between control and tamoxifen-treated PE conditional knockout NOTCH1-induced leukemias. Cutoffs used: Wald statistic < −5 or > 5; P-adjusted value < 1E-04; sorted based on mean expression levels in tamoxifen-treated samples (for full list of significantly downregulated genes upon tamoxifen treatment, see Supplementary Fig. S12A). The scale bar shows color-coded differential expression with red indicating higher levels of expression and blue indicating lower levels of expression. F, Gene Set Enrichment Analysis (GSEA) of genes regulated by PTEN in vehicle only-treated compared to tamoxifen-treated PE conditional knockout NOTCH1-induced leukemia cells in vivo. G, H3K27ac ChIP-seq mark in DND41 T-ALL cells along the PTEN-containing TAD and schematic representation of chromosome 10q23 focal deletions (red bars) found in human T-ALL. H, PTEN mRNA expression levels in human primary T-ALL samples (n=360). Samples are subdivided according to the presence/absence of PTEN coding sequence (CDS) deletions, the presence/absence of PTEN CDS deletions affecting it transcriptional start site (TSS) and the presence/absence of PE focal deletions. P value was calculated using t-test. I, PE focal deletions found specifically in T-ALL but not B-ALL. P value calculated using Fisher’s exact test.
