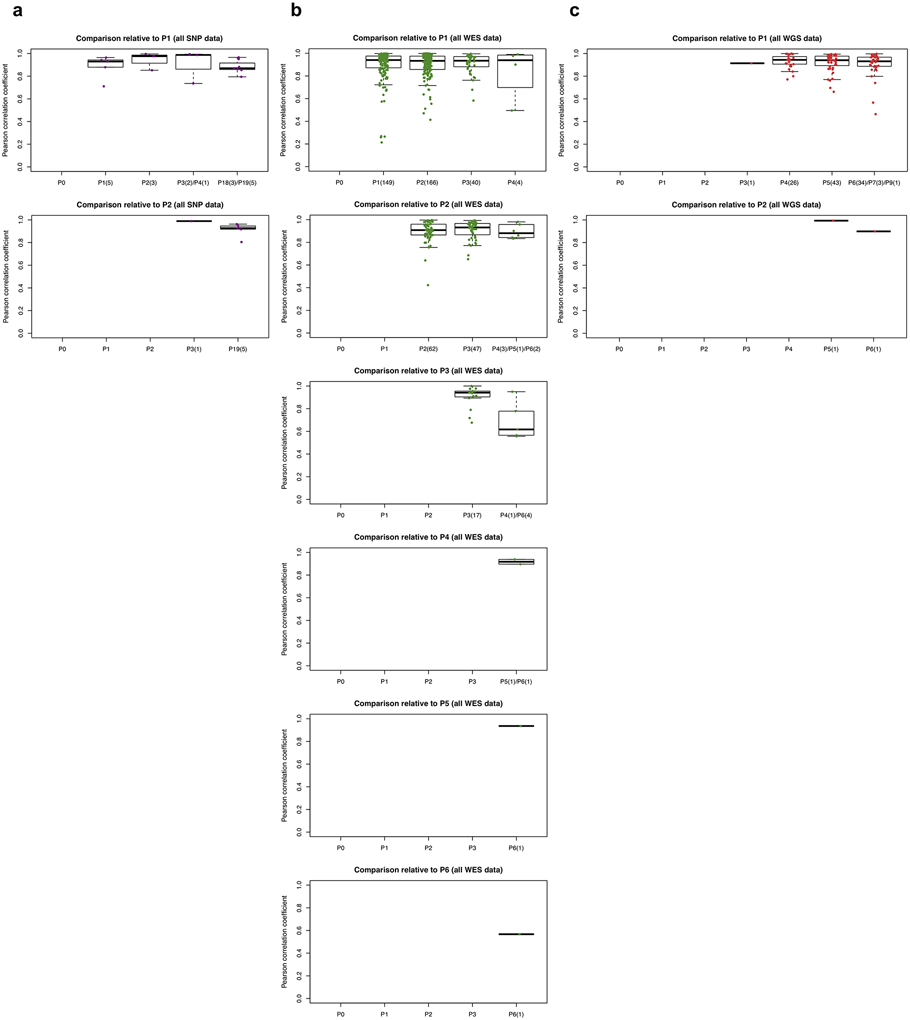
Extended Data Fig. 5. Distribution of Pearson correlation coefficients of gene-based copy number.

a-c, Estimated by SNP array (a), WES (b), and WGS (c) between different combinations of patient tumor and PDX passages of the same model. Comparisons relative to passages P1 or later passages (refer to Fig. 3d-f for comparisons with PT and P0). In the boxplots, the center line is the median, box limits are the upper and lower quantiles, whiskers extend 1.5× the interquartile range, and dots represent all data points.
