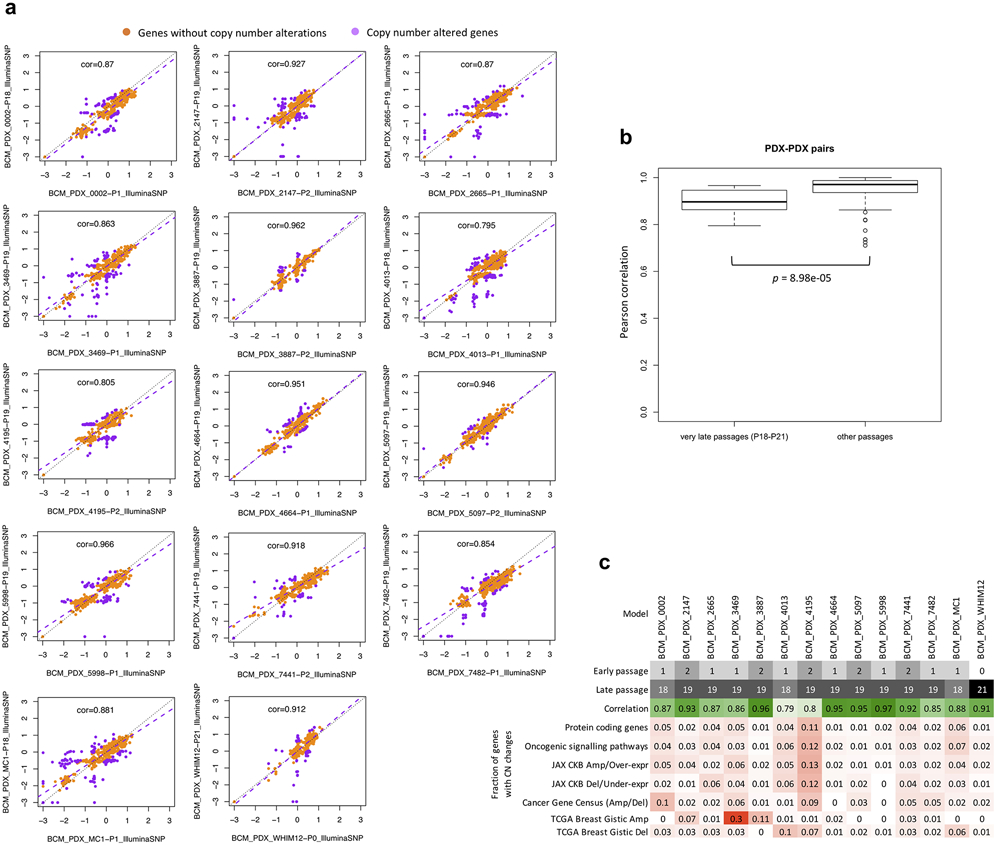
Extended Data Fig. 6. Comparison of CNA between early and very-late passages.

In the BCM SNP array breast cancer dataset. a, Correlation and robust regression of gene-based copy number between early (P0-P2) and very-late passages (P18-P21) of the same model. Genes with copy number changes between the passages are identified by ∣residual∣ > 0.5. Some genes show signs of complete deletion (log2(CN ratio) < −2) but then reappear in later passages. This can only be explained by the early and late passages being dominated by different pre-existing subclones. b, Distribution of Pearson correlation coefficients of gene-based copy number between early and very-late passages of the same model (14 models/pairwise correlations) compared to correlation coefficients between lower passages denoted as “other passages” (< P4). Correlation for “other passages” are based on models from all other non-BCM SNP array datasets (111 pairwise correlations). P-values were computed by one-sided Wilcoxon rank sum test. In all boxplots, the center line is the median, box limits are the upper and lower quantiles, whiskers extend 1.5× the interquartile range, and dots represent outliers. c, Summary of passage numbers, copy number correlation, and fraction of genes of different gene sets with copy number changes (∣residual∣ > 0.5) between passages of each breast cancer model.
