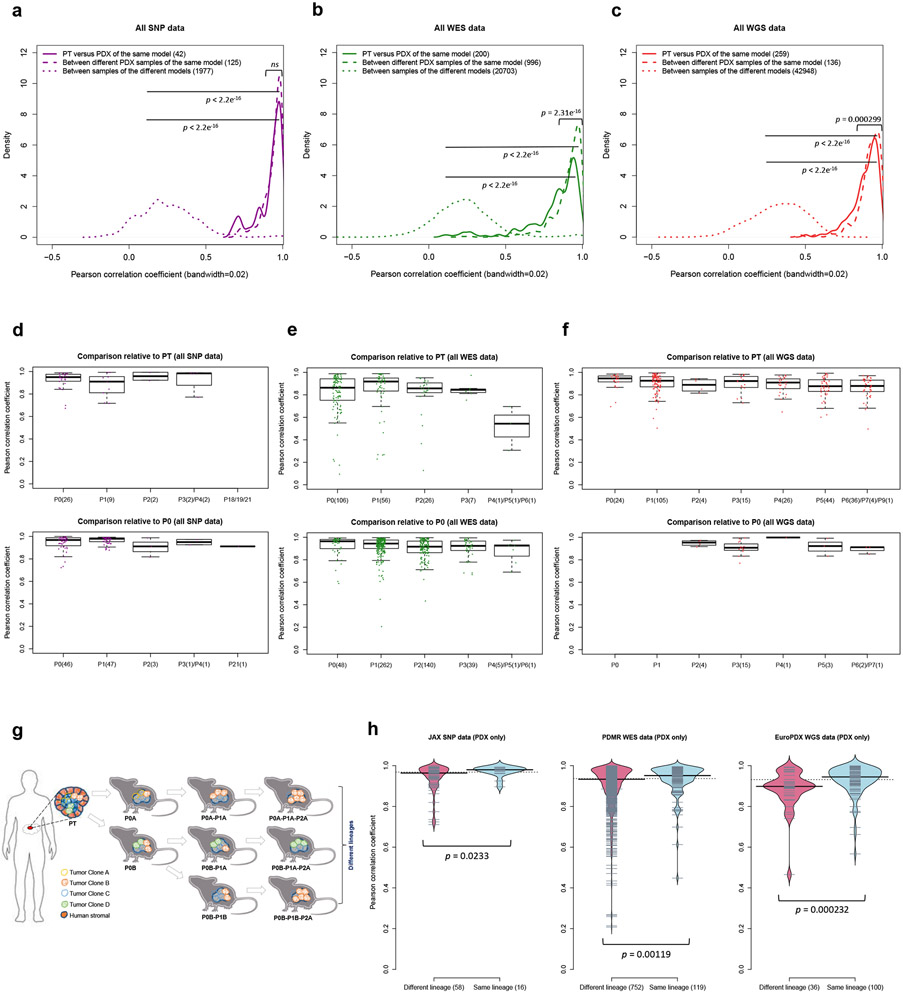
Fig. 3: Comparisons of copy number alterations from patient tumor to early and late PDX passages.
(a-c) Distributions of Pearson correlation coefficient of gene-based copy number, estimated by (a) SNP array, (b) WES, and (c) WGS, between: PT-PDX samples from the same model; PDX-PDX samples of the same model; samples of different models from a common tumor type and contributing center. P-values were computed by one-sided Wilcoxon rank sum test (ns: not significant, p > 0.05). Number of pairwise correlations are indicated in the legend. (d-f) Distributions of Pearson correlation coefficients of gene-based copy number, estimated by (d) SNP array, (e) WES, and (f) WGS, among patient tumor and PDX passages of the same model. Comparisons relative to PT and P0 are shown (higher passages are shown in Extended Data Fig. 5). In the boxplots, the center line is the median, box limits are the upper and lower quantiles, whiskers extend 1.5 × the interquartile range, dots represent the all data points. (g) Schematic of lineage splitting during passaging and expansion of tumors into multiple mice. This is a simplified illustration for passaging procedures in which different fragments of a tumor are implanted into different mice. (h) Pearson correlation distributions for PDX sample pairs of different lineages and sample pairs within the same lineage: for JAX SNP array, PDMR WES, and EuroPDX WGS datasets. P-values were computed by one-sided Wilcoxon rank sum test. For all boxplots and violin plots, number of pairwise correlations are indicated in the horizontal axis labels.

