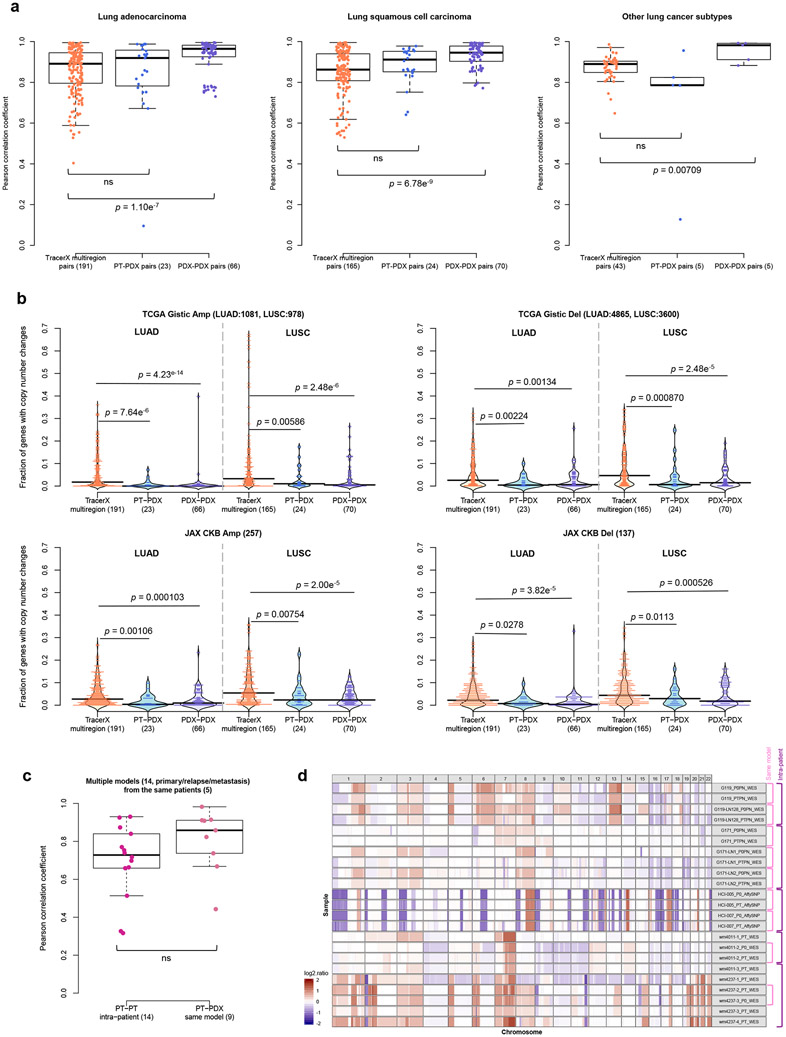
Fig. 6: Comparison of CNA variation during PDX engraftment and passaging to CNA variation among patient multi-region, tumor relapse, and metastasis samples.
(a) Distributions of Pearson correlation coefficients of gene-based copy number for lung adenocarcinoma (LUAD), lung squamous cell carcinoma (LUSC), and other lung cancer subtypes, comparing different datasets. TracerX multiregion: multi-region tumor samples of the same patient from TRACERx (92 patient tumors, 295 multi-region samples); PT-PDX samples of the same model; PDX-PDX samples of the same model. P-values were computed by two-sided Wilcoxon rank sum test (ns: not significant, p > 0.05). (b) Distributions of proportion of altered genes between multi-region tumor pairs from TRACERx, and PT-PDX and PDX-PDX pairs for various gene sets for LUAD and LUSC. Gene sets and CNA thresholds are the same as Fig. 4. TCGA Gistic Amp/Del and JAX CKB Amp Del gene sets are shown (other gene sets are shown in Extended Data Fig. 8). P-values were computed by one-sided Wilcoxon rank sum test. Number of genes per gene set are indicated in the plot title. (c) Distributions of Pearson correlation coefficients of gene-based copy number between intra-patient PT (primary/relapse/metastasis) pairs from the same patient and corresponding PT-PDX (derived from the same model; a different PT sample from the same patient generates a different model) pairs for the same set of patients. P-values were computed by two-sided Wilcoxon rank sum test (ns: not significant, p > 0.05). Number of patients and models are indicated in the plot title. For all box plots and violin plots, number of pairwise comparisons are indicated in the horizontal axis labels. In all boxplots, the center line is the median, box limits are the upper and lower quantiles, whiskers extend 1.5 × the interquartile range, dots represent the all data points. (d) CNA profiles of PT and PDX samples from patients with PDX models derived from multiple PT collection (primary/relapse/metastasis).

