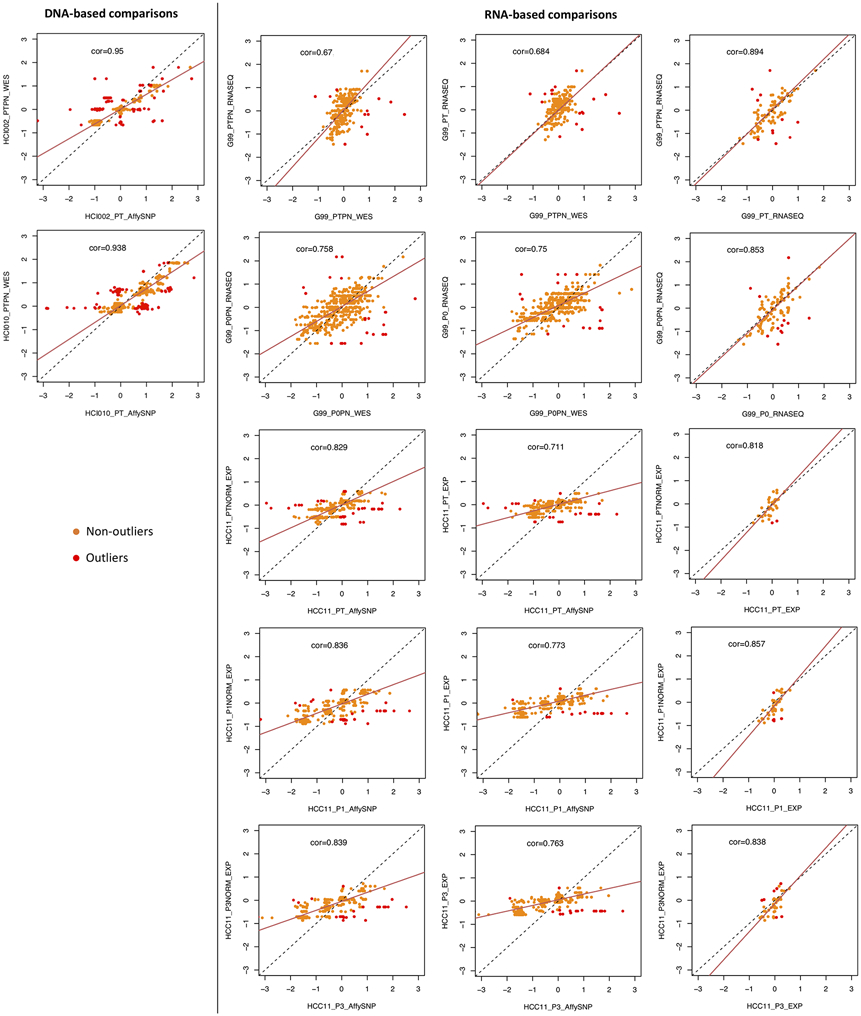
Extended Data Fig. 2. Comparison of copy number between different platforms.

Pearson correlation and linear regression of the log2(CN ratio) of 100-kb windows binned from copy number segments of CNA profiles between matched patient tumor samples estimated from different platforms or analysis methods for examples shown in Figure 2d. Outliers of the linear regression are identified by studentized residuals > 3 and < −3. RNA-seq and expression array samples denoted with “PN” or “NORM” are normalized by the median expression of normal samples.
