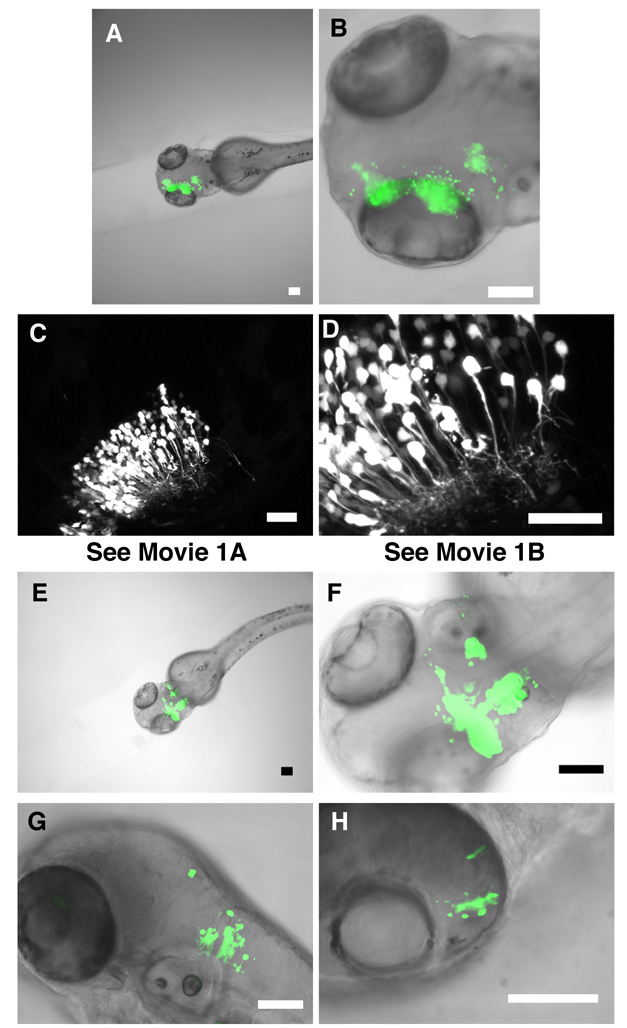
Fig. 1.
Delivering GFP expression plasmids to large regions of the developing brain by in vivo electroporation. A,B: Embryos were electroporated at 24 hpf. Combined fluorescence (green) and bright-field (gray scale) images of embryos 24 hours after electroporation show GFP expression in large regions of the developing brain. C,D: Confocal images demonstrate the typical neurite morphology of GFP-expressing neurons of the optic tectum. These images represent a z-projection of a series of confocal slices acquired by focusing dorsal to ventral through the area of labeled neurons. Movies 1A and 1B are animated versions of the stacks of confocal images through this section of optic tectum, which demonstrate the number of cells expressing GFP within a given section of brain, and also reveal the elaborated structure of neurites. E,F: Combined fluorescence (green) and bright-field (gray scale) images of embryos 24 hours after electroporation showing GFP expression in the early developing cerebellum. G,H: Combined fluorescence (green) and bright-field (gray scale) images of embryos 24 hours after electroporation showing GFP expression in the hindbrain (G) and retina (H). Scale bars equal 100 microns (A,B, E-H); and 50 microns (C,D).

