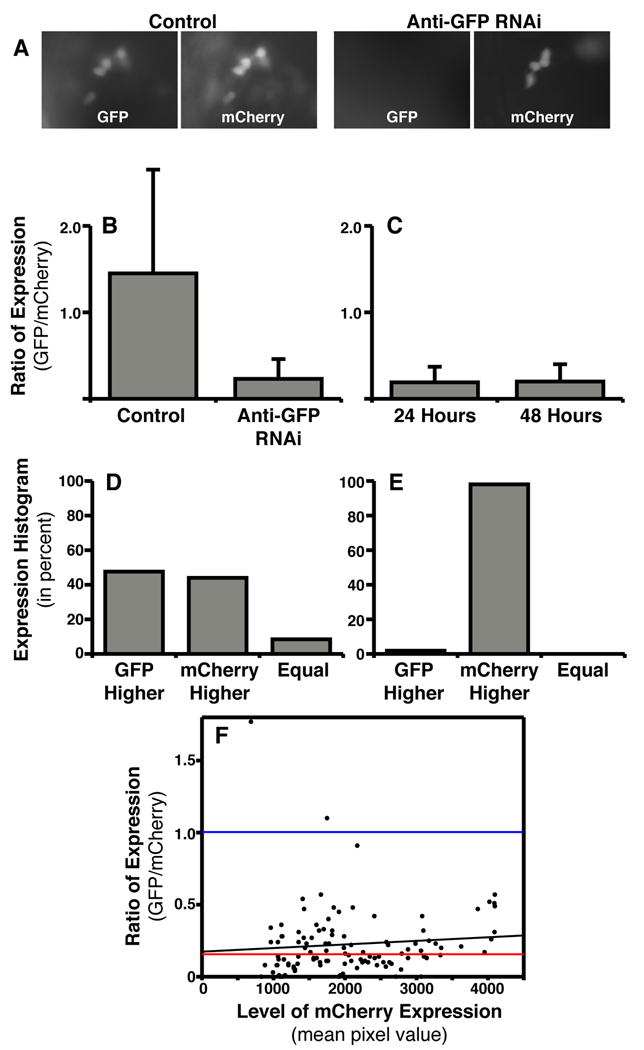
Fig. 6.
Using in vivo electroporation for RNAi-based loss-of-function. A: Fluorescent images showing that co-electroporation of an anti-GFP targeted siRNA along with an expression plasmid for GFP leads to decreased GFP fluorescence as compared to cells electroporated with a non-targeting siRNA. A plasmid coding for mCherry was also included in order to identify the cells successfully electroporated. B: The degree to which GFP expression was blocked was quantified by ratioing GFP to mCherry fluorescence in single cells (see Experimental Procedures). Control electroporations included a non-targeting siRNA, a GFP expression plasmid, and an mCherry expression plasmid. Anti-GFP RNAi electroporations included an siRNA targeting GFP, a GFP expression plasmid, and an mCherry expression plasmid. C: The degree to which GFP expression was blocked was analyzed in the same embryos 24 and 48 hours after electroporation. D: Histogram of all control cells analyzed. The cells have been categorized by the GFP/mCherry ratio for three different categories: (i) GFP higher expressed, (ii) mCherry higher expressed, or (iii) equal expression of GFP and mCherry (within 5%). E: Histogram for all anti-GFP RNAi cells analyzed. F: The GFP/mCherry ratio for all analyzed anti-GFP RNAi cells plotted against the total mCherry fluorescence (mean pixel value). This graph represents the degree of knockdown (ratio) as a function of total expression via the plasmids (mCherry expression). Black line represents a linear regression of all RNAi data. Red line represents the median ratio for RNAi cells. Blue line represents the median ratio for all control cells (note: control cells are not plotted on the graph).

